## Line Chart: Proportion of Flips in Qwen2.5-14B Across Iterations
### Overview
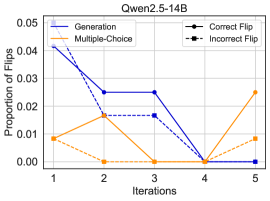
The chart illustrates the proportion of "flips" (likely model output changes) across two methods ("Generation" and "Multiple-Choice") over five iterations. A secondary legend indicates "Correct Flip" (solid black) and "Incorrect Flip" (dashed black), though these lines are not visibly plotted. Key trends include sharp declines in the "Generation" method and fluctuating behavior in the "Multiple-Choice" method.
### Components/Axes
- **X-axis (Iterations)**: Labeled "Iterations" with discrete markers at 1, 2, 3, 4, and 5.
- **Y-axis (Proportion of Flips)**: Labeled "Proportion of Flips," scaled from 0.00 to 0.05 in increments of 0.01.
- **Legend**: Located in the top-right corner, with:
- **Generation**: Solid blue line with square markers.
- **Multiple-Choice**: Dashed orange line with diamond markers.
- **Correct Flip**: Solid black line (no visible data).
- **Incorrect Flip**: Dashed black line (no visible data).
### Detailed Analysis
1. **Generation (Blue Line)**:
- **Iteration 1**: Starts at ~0.045 (highest value).
- **Iteration 2**: Drops to ~0.025.
- **Iterations 3–5**: Remains flat at ~0.025 until iteration 4, then plummets to 0.00.
- **Trend**: Sharp initial decline, followed by stabilization and a final collapse.
2. **Multiple-Choice (Orange Line)**:
- **Iteration 1**: Begins at ~0.008.
- **Iteration 2**: Rises to ~0.018.
- **Iteration 3**: Drops to 0.00.
- **Iteration 4**: Remains at 0.00.
- **Iteration 5**: Spikes to ~0.025.
- **Trend**: Volatile, with a late-stage surge.
3. **Correct/Incorrect Flips (Black Lines)**:
- Both lines are flat at 0.00 across all iterations, suggesting no recorded flips in these categories.
### Key Observations
- The "Generation" method shows a dramatic reduction in flips after iteration 2, stabilizing until iteration 4 before collapsing entirely.
- The "Multiple-Choice" method exhibits erratic behavior, with a notable late-stage increase at iteration 5.
- "Correct Flip" and "Incorrect Flip" categories show no activity, raising questions about their relevance to the plotted data.
### Interpretation
The data suggests that the "Generation" method becomes more stable (or less prone to flips) over time, though its final collapse at iteration 5 is puzzling. The "Multiple-Choice" method’s late-stage spike may indicate a specific trigger or anomaly in that iteration. The absence of "Correct/Incorrect Flip" data implies these categories might be excluded from the analysis or represent a separate metric. The stark contrast between the two methods highlights divergent performance characteristics, potentially reflecting differences in model architecture or training objectives.