\n
## Line Chart: CIFAR-10 Test Accuracy vs. d1
### Overview
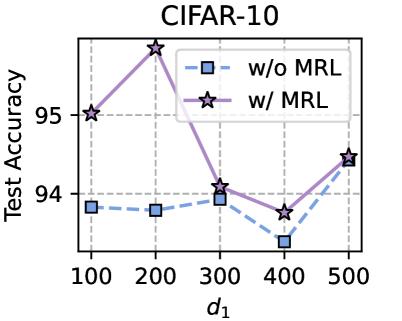
This line chart displays the test accuracy of a model on the CIFAR-10 dataset, comparing performance with and without a feature called "MRL" (likely a regularization technique). The x-axis represents a parameter 'd1', and the y-axis represents the test accuracy. Two lines are plotted, one for the model without MRL and one for the model with MRL.
### Components/Axes
* **Title:** CIFAR-10 (top-center)
* **X-axis Label:** d1 (bottom-center)
* **X-axis Markers:** 100, 200, 300, 400, 500
* **Y-axis Label:** Test Accuracy (left-center)
* **Y-axis Scale:** Ranges from approximately 93 to 96.
* **Legend:** Located in the top-right corner.
* "w/o MRL" - Represented by a blue dashed line with square markers.
* "w/ MRL" - Represented by a purple solid line with star markers.
### Detailed Analysis
**Line 1: w/o MRL (Blue Dashed Line)**
This line shows a relatively flat trend.
* At d1 = 100, Test Accuracy ≈ 93.4
* At d1 = 200, Test Accuracy ≈ 93.6
* At d1 = 300, Test Accuracy ≈ 93.8
* At d1 = 400, Test Accuracy ≈ 93.2
* At d1 = 500, Test Accuracy ≈ 93.7
**Line 2: w/ MRL (Purple Solid Line)**
This line exhibits a more pronounced trend, initially increasing and then decreasing.
* At d1 = 100, Test Accuracy ≈ 95.2
* At d1 = 200, Test Accuracy ≈ 96.1
* At d1 = 300, Test Accuracy ≈ 94.4
* At d1 = 400, Test Accuracy ≈ 93.5
* At d1 = 500, Test Accuracy ≈ 94.6
### Key Observations
* The model *with* MRL generally achieves higher test accuracy than the model *without* MRL, especially at lower values of d1 (100 and 200).
* The accuracy of the model *with* MRL peaks at d1 = 200, then declines at d1 = 300 and d1 = 400, before slightly recovering at d1 = 500.
* The model *without* MRL shows minimal variation in accuracy across the range of d1 values.
### Interpretation
The data suggests that the MRL feature improves the model's test accuracy on the CIFAR-10 dataset, but its effectiveness is dependent on the value of the parameter 'd1'. At lower values of 'd1', MRL provides a significant boost in accuracy. However, as 'd1' increases beyond 200, the benefit of MRL diminishes, and at d1 = 400, the accuracy drops to a level comparable to the model without MRL. This could indicate that 'd1' represents a hyperparameter that interacts with MRL, and there's an optimal range for 'd1' where MRL is most effective. The flat performance of the model without MRL suggests it is less sensitive to changes in 'd1'. The peak at d1=200 for the MRL model suggests a sweet spot where the regularization is most effective. Further investigation would be needed to understand the nature of 'd1' and its relationship to the MRL feature.