## Line Graph: CIFAR-10 Test Accuracy vs. d1 Parameter
### Overview
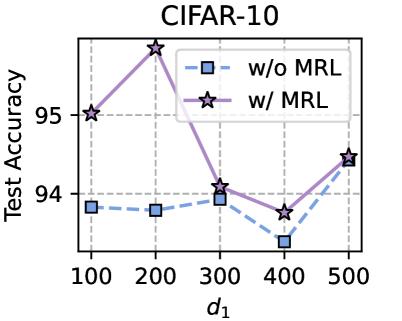
The chart compares test accuracy (y-axis) against a parameter `d1` (x-axis) for two configurations: "w/o MRL" (without MRL) and "w/ MRL" (with MRL). The data is plotted using dashed blue lines with square markers for "w/o MRL" and solid purple lines with star markers for "w/ MRL". The graph highlights performance trends across five `d1` values (100, 200, 300, 400, 500).
### Components/Axes
- **X-axis (d1)**: Labeled "d₁", with discrete values at 100, 200, 300, 400, 500.
- **Y-axis (Test Accuracy)**: Labeled "Test Accuracy", ranging from 94 to 95.5.
- **Legend**: Located in the top-right corner, with two entries:
- **Blue dashed line + squares**: "w/o MRL"
- **Purple solid line + stars**: "w/ MRL"
### Detailed Analysis
#### "w/o MRL" (Blue Dashed Line)
- **Trend**: Relatively flat with minor fluctuations.
- **Data Points**:
- d1=100: ~94.0
- d1=200: ~94.0
- d1=300: ~94.1
- d1=400: ~93.7
- d1=500: ~94.5
#### "w/ MRL" (Purple Solid Line)
- **Trend**: Peaks at d1=200, then declines and recovers.
- **Data Points**:
- d1=100: ~95.0
- d1=200: ~95.5 (peak)
- d1=300: ~94.1
- d1=400: ~93.8
- d1=500: ~94.5
### Key Observations
1. **Performance Gap**: "w/ MRL" consistently outperforms "w/o MRL" except at d1=500, where accuracies converge (~94.5).
2. **Peak at d1=200**: "w/ MRL" achieves its highest accuracy (95.5) at d1=200, suggesting optimal performance at this parameter value.
3. **Dip at d1=400**: Both configurations show a notable drop in accuracy at d1=400, with "w/ MRL" falling to ~93.8.
4. **Stability**: "w/o MRL" exhibits smoother trends, while "w/ MRL" shows sharper fluctuations.
### Interpretation
The graph demonstrates that MRL improves test accuracy for most `d1` values, particularly at lower ranges (d1=100–300). However, the performance advantage diminishes at higher `d1` values (e.g., d1=500). The dip at d1=400 for "w/ MRL" may indicate a sensitivity to parameter tuning or overfitting risks. The convergence at d1=500 suggests diminishing returns for MRL as `d1` increases. This could imply that MRL’s benefits are context-dependent, requiring careful calibration of `d1` for optimal results.
### Spatial Grounding & Validation
- Legend placement (top-right) aligns with standard chart conventions.
- Line colors and markers match legend labels:
- Blue dashed line + squares = "w/o MRL" (confirmed at all points).
- Purple solid line + stars = "w/ MRL" (confirmed at all points).
- Axis labels and scales are explicitly defined, with no ambiguity in units or ranges.
### Uncertainties
- Exact numerical values are approximate (e.g., 94.5 ±0.1) due to visual estimation from the graph.
- The cause of the d1=400 dip remains unexplained by the chart alone.