## Chart Type: Scatter Plot Grid
### Overview
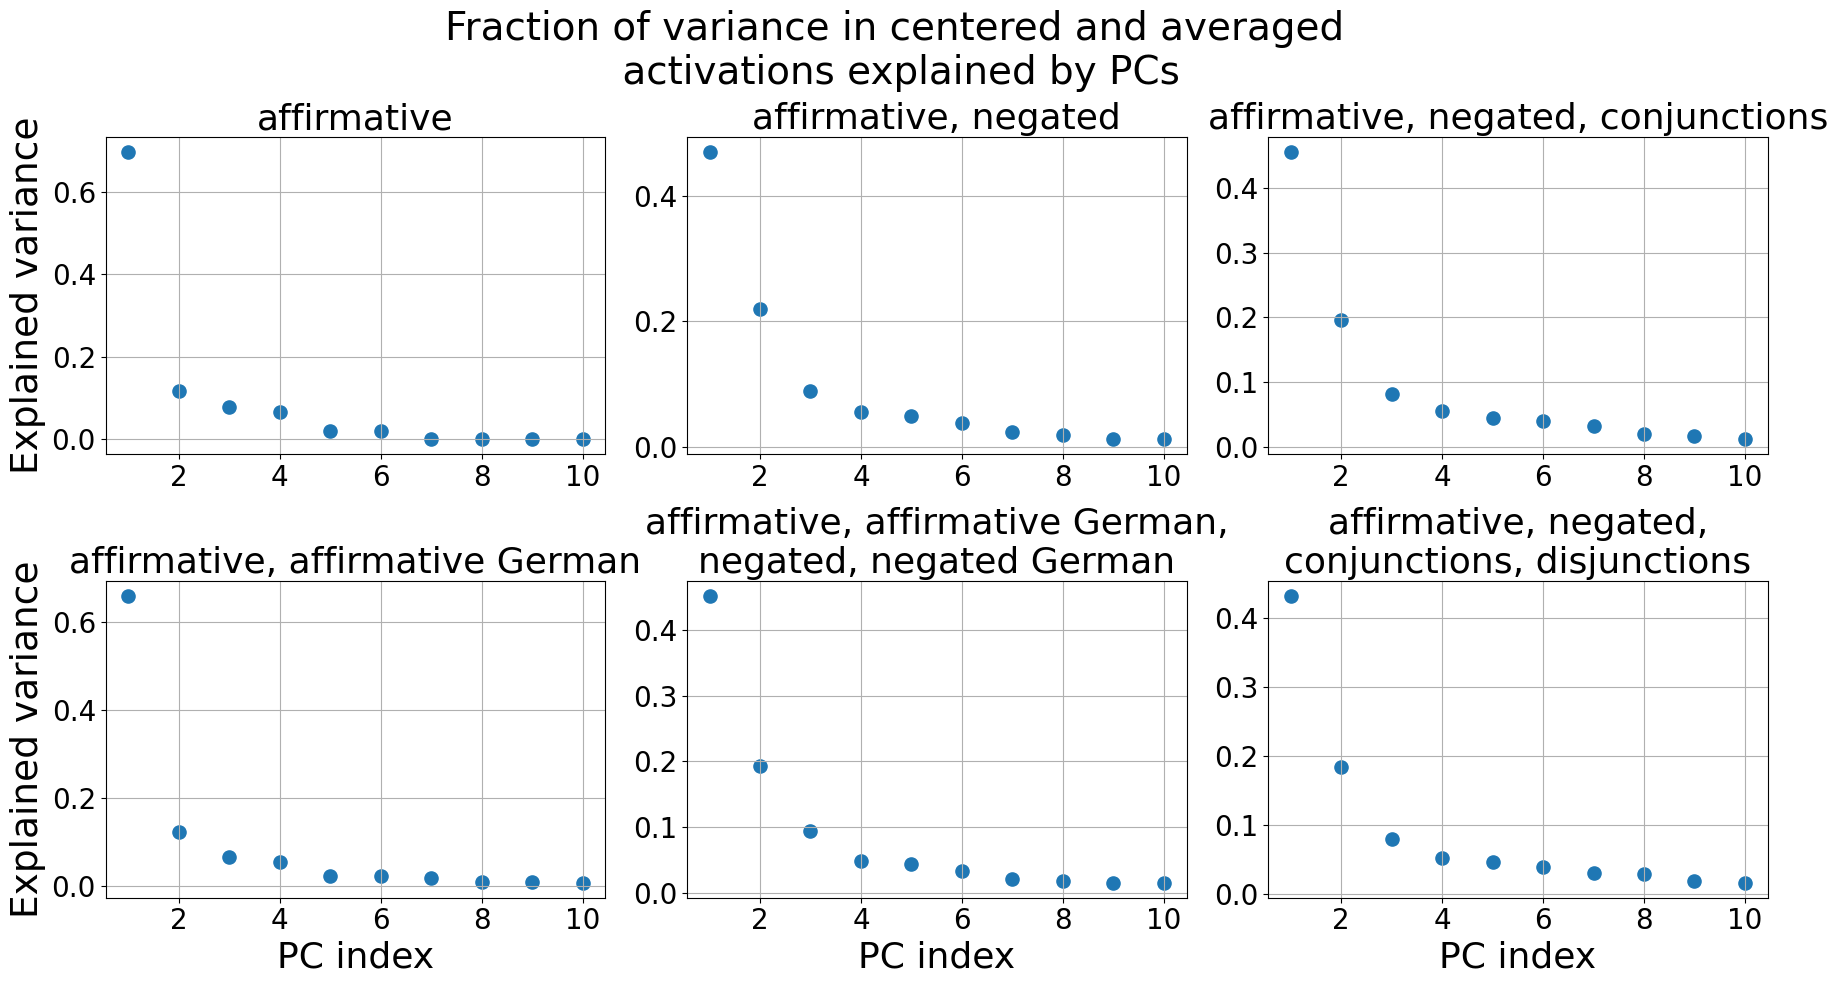
The image presents a grid of six scatter plots. Each plot shows the fraction of variance explained by principal components (PCs) for different conditions related to sentence types. The x-axis represents the PC index (from 1 to 10), and the y-axis represents the explained variance (from 0.0 to approximately 0.7). All plots share the same axes scales.
### Components/Axes
* **Title:** "Fraction of variance in centered and averaged activations explained by PCs"
* **X-axis:** "PC index" with ticks at 2, 4, 6, 8, and 10.
* **Y-axis:** "Explained variance" with ticks at 0.0, 0.2, 0.4, and 0.6 (or 0.3 in some plots).
* **Plots (from top-left to bottom-right):**
1. "affirmative"
2. "affirmative, negated"
3. "affirmative, negated, conjunctions"
4. "affirmative, affirmative German"
5. "affirmative, affirmative German, negated, negated German"
6. "affirmative, negated, conjunctions, disjunctions"
### Detailed Analysis
Each plot displays a series of blue data points. The general trend across all plots is a rapid decrease in explained variance from PC index 1 to PC index 2, followed by a gradual decline towards PC index 10.
* **Plot 1: "affirmative"**
* PC 1: Approximately 0.67
* PC 2: Approximately 0.12
* PC 10: Approximately 0.00
* **Plot 2: "affirmative, negated"**
* PC 1: Approximately 0.45
* PC 2: Approximately 0.22
* PC 10: Approximately 0.01
* **Plot 3: "affirmative, negated, conjunctions"**
* PC 1: Approximately 0.45
* PC 2: Approximately 0.20
* PC 10: Approximately 0.01
* **Plot 4: "affirmative, affirmative German"**
* PC 1: Approximately 0.65
* PC 2: Approximately 0.12
* PC 10: Approximately 0.01
* **Plot 5: "affirmative, affirmative German, negated, negated German"**
* PC 1: Approximately 0.45
* PC 2: Approximately 0.20
* PC 10: Approximately 0.01
* **Plot 6: "affirmative, negated, conjunctions, disjunctions"**
* PC 1: Approximately 0.43
* PC 2: Approximately 0.18
* PC 10: Approximately 0.01
### Key Observations
* The first principal component (PC 1) consistently explains the largest fraction of variance across all conditions.
* The explained variance decreases rapidly from PC 1 to PC 2.
* Beyond PC 2, the explained variance decreases gradually and approaches zero.
* The "affirmative" and "affirmative, affirmative German" conditions show the highest explained variance by PC 1 (around 0.65-0.67).
* The other conditions ("affirmative, negated", "affirmative, negated, conjunctions", "affirmative, affirmative German, negated, negated German", and "affirmative, negated, conjunctions, disjunctions") have lower explained variance by PC 1 (around 0.43-0.45).
### Interpretation
The plots suggest that the first few principal components capture the majority of the variance in the centered and averaged activations. The rapid decrease in explained variance indicates that the underlying data can be effectively represented by a lower-dimensional space spanned by these principal components. The "affirmative" and "affirmative, affirmative German" conditions have higher explained variance by PC 1, suggesting that these conditions might have a more dominant underlying structure compared to the other conditions involving negation, conjunctions, and disjunctions. The inclusion of negation and logical operators seems to distribute the variance across more principal components, leading to a lower fraction of variance explained by the first component.