## Scatter Plots: Fraction of Variance Explained by PCs
### Overview
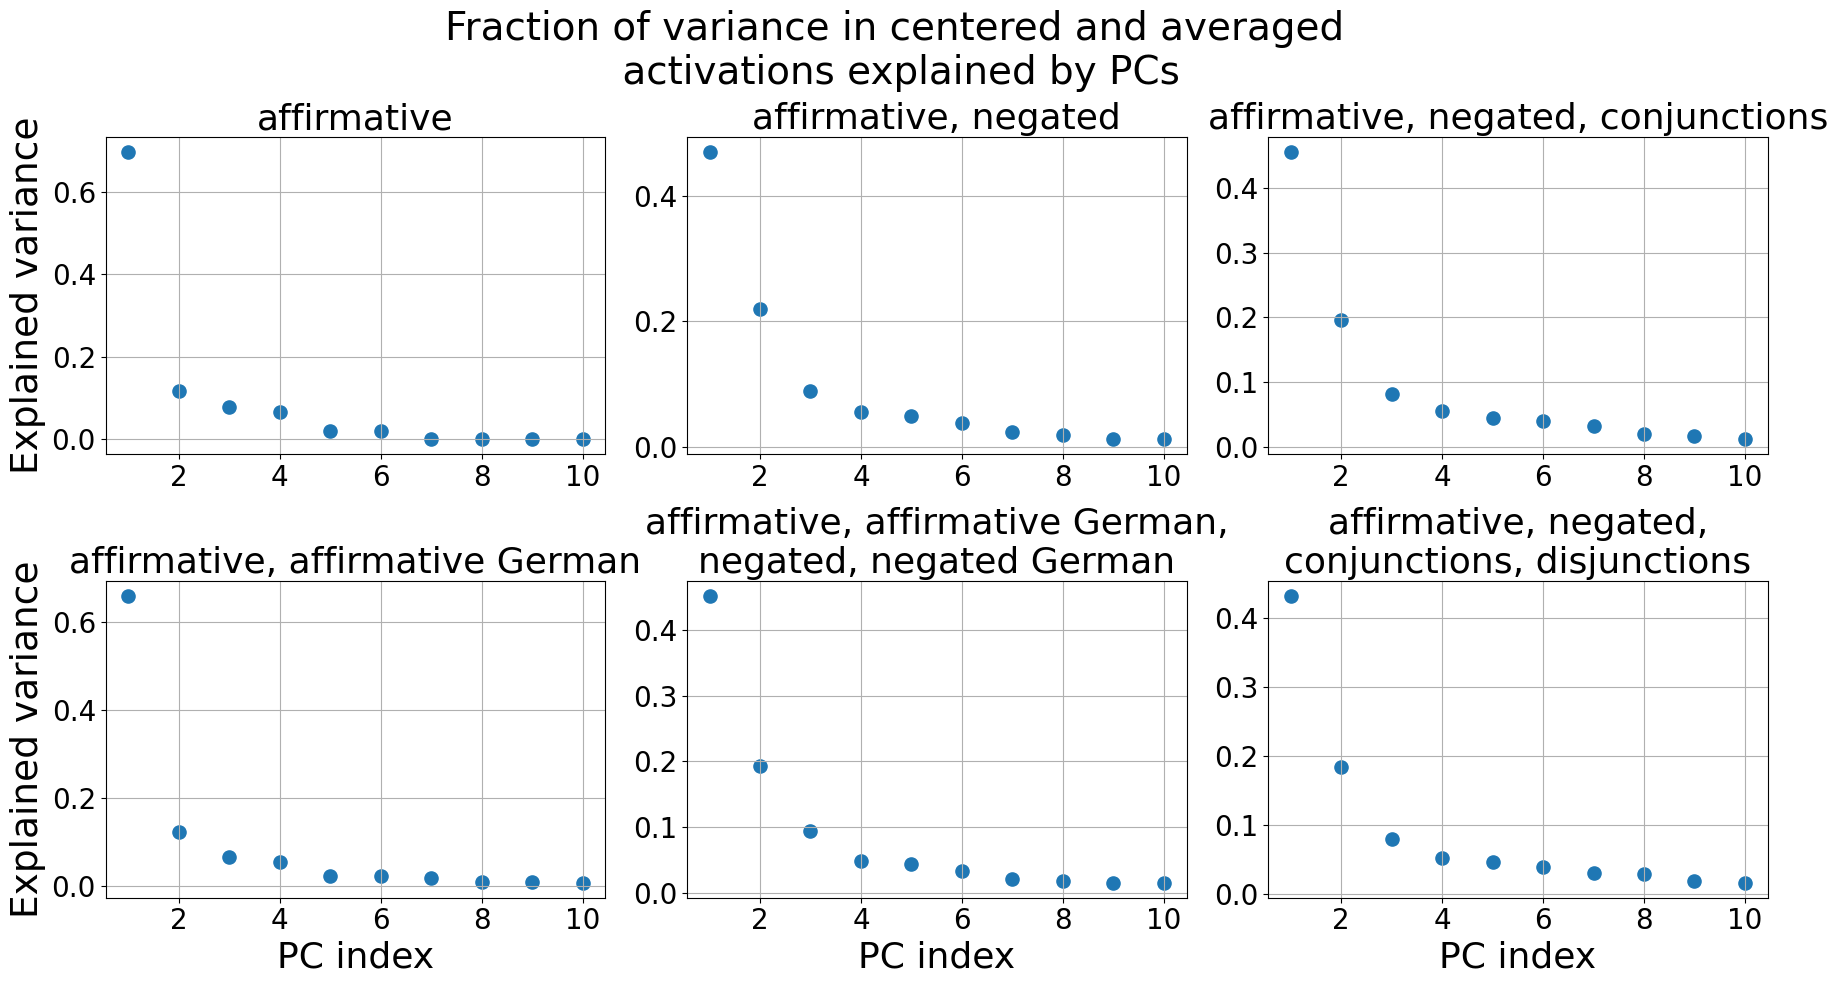
The image presents six scatter plots, each representing the fraction of variance in centered and averaged activations explained by Principal Components (PCs). Each plot corresponds to a different condition or combination of conditions: affirmative, affirmative/negated, affirmative/negated/conjunctions, affirmative/affirmative German, negated/negated German, and affirmative/negated/conjunctions/disjunctions. The x-axis represents the PC index (ranging from 1 to 10), and the y-axis represents the explained variance (ranging from 0 to approximately 0.6).
### Components/Axes
* **Title:** "Fraction of variance in centered and averaged activations explained by PCs" (centered at the top)
* **X-axis Label (all plots):** "PC index" (ranging from 1 to 10)
* **Y-axis Label (all plots):** "Explained variance" (ranging from 0 to 0.6)
* **Plot Titles (from top-left to bottom-right):**
1. "affirmative"
2. "affirmative, negated"
3. "affirmative, negated, conjunctions"
4. "affirmative, affirmative German"
5. "affirmative, negated, negated German"
6. "affirmative, negated, conjunctions, disjunctions"
### Detailed Analysis
Here's a breakdown of each plot, noting trends and approximate data points:
**1. affirmative:**
* Trend: The explained variance starts relatively high at PC index 1 and then rapidly decreases, remaining low for the rest of the indices.
* Data Points (approximate):
* PC 1: 0.15
* PC 2: 0.02
* PC 3: 0.01
* PC 4-10: ~0.005
**2. affirmative, negated:**
* Trend: The explained variance is higher for the first few PCs (1-3) and then declines to near zero.
* Data Points (approximate):
* PC 1: 0.23
* PC 2: 0.12
* PC 3: 0.08
* PC 4-10: ~0.01
**3. affirmative, negated, conjunctions:**
* Trend: Similar to the previous plot, with higher variance for the first few PCs and a decline.
* Data Points (approximate):
* PC 1: 0.25
* PC 2: 0.21
* PC 3: 0.09
* PC 4-10: ~0.01
**4. affirmative, affirmative German:**
* Trend: The explained variance is highest at PC index 1 and then rapidly decreases, remaining low for the rest of the indices.
* Data Points (approximate):
* PC 1: 0.45
* PC 2: 0.02
* PC 3: 0.01
* PC 4-10: ~0.005
**5. affirmative, negated, negated German:**
* Trend: The explained variance is higher for the first few PCs (1-3) and then declines to near zero.
* Data Points (approximate):
* PC 1: 0.25
* PC 2: 0.13
* PC 3: 0.08
* PC 4-10: ~0.01
**6. affirmative, negated, conjunctions, disjunctions:**
* Trend: The explained variance is higher for the first few PCs (1-3) and then declines to near zero.
* Data Points (approximate):
* PC 1: 0.23
* PC 2: 0.11
* PC 3: 0.08
* PC 4-10: ~0.01
### Key Observations
* The "affirmative" and "affirmative, affirmative German" plots show a strong initial PC explaining a significant portion of the variance, with subsequent PCs contributing very little.
* The plots including "negated," "conjunctions," and "disjunctions" show a more distributed variance across the first few PCs, indicating that these factors require more PCs to explain the variance in activations.
* The explained variance generally decreases as the PC index increases across all conditions.
### Interpretation
These plots suggest that the variance in centered and averaged activations is largely captured by the first few Principal Components. The specific conditions (affirmative, negated, etc.) influence how this variance is distributed across the PCs. The conditions involving negation, conjunctions, and disjunctions require more PCs to explain the variance, suggesting that these linguistic features introduce more complexity in the activation patterns. The high variance explained by the first PC in the "affirmative" and "affirmative, affirmative German" conditions indicates that a single dominant factor captures much of the variability in these cases. The inclusion of German does not appear to drastically alter the variance explained by the first PC in the "affirmative, affirmative German" condition. The plots provide insight into the underlying structure of the data and how different linguistic features contribute to the variance in neural activations.