## Scatter Plot Grid: Fraction of Variance Explained by Principal Components
### Overview
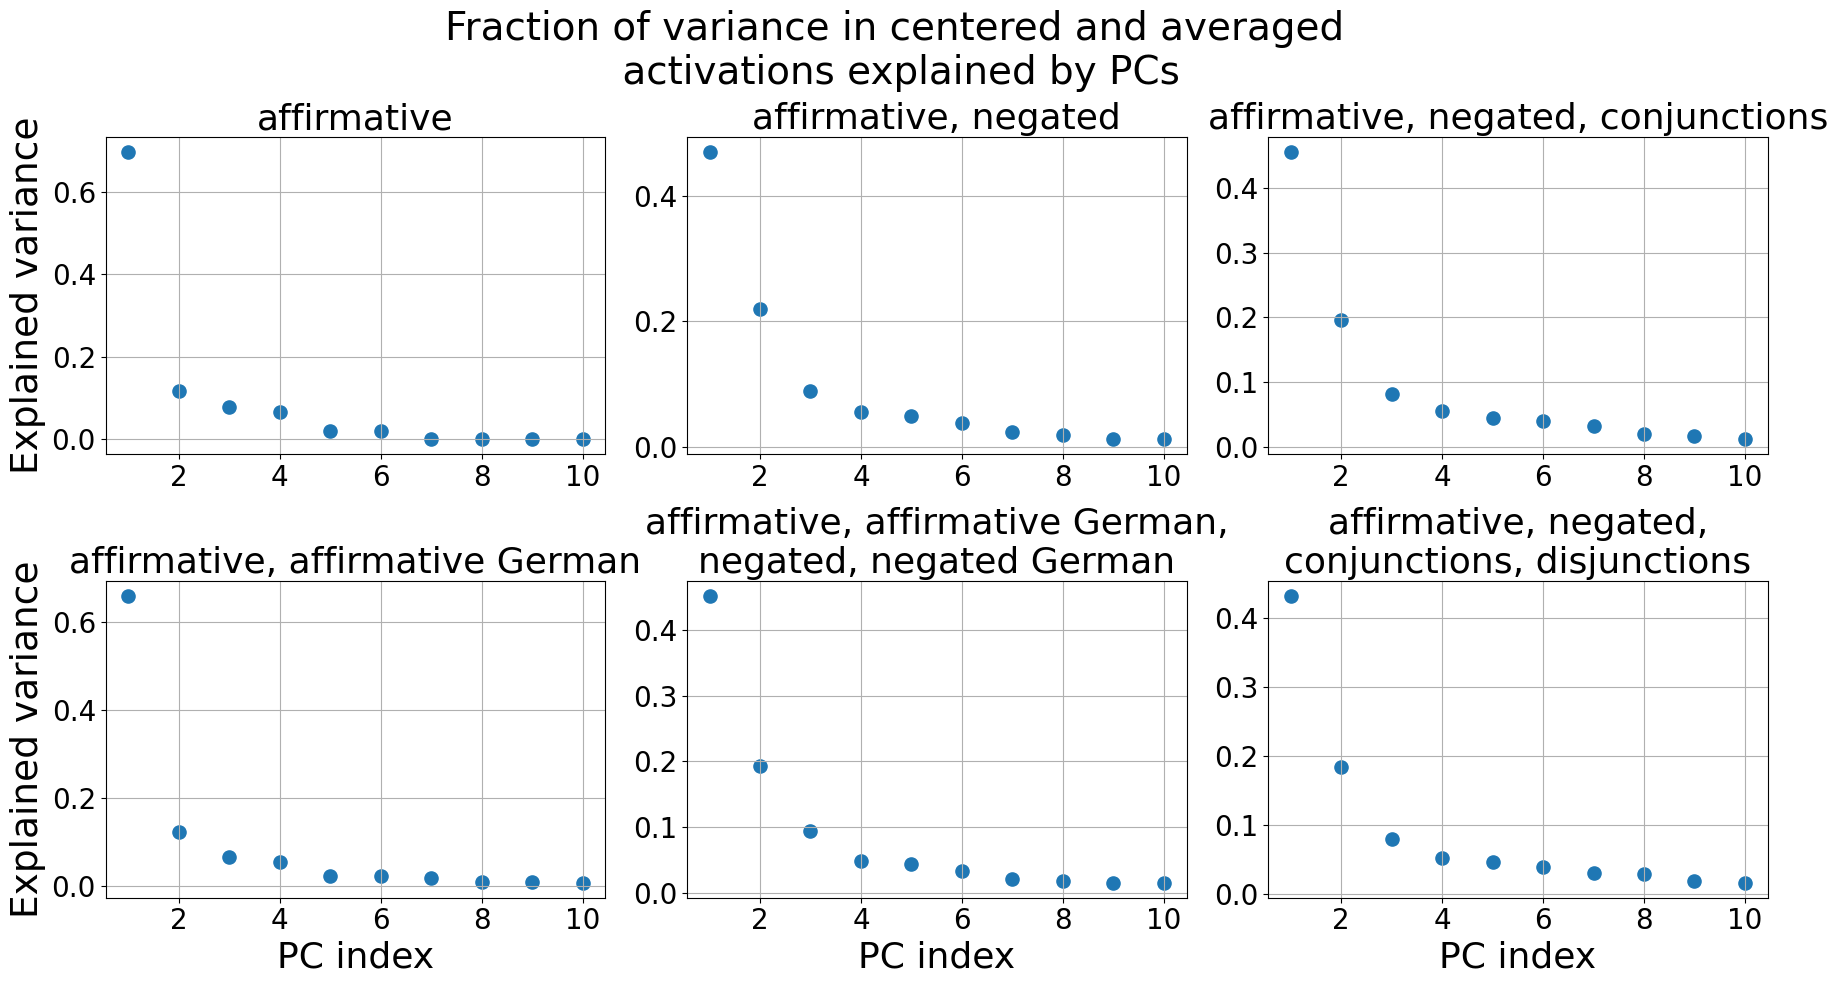
The image displays a 2x3 grid of six scatter plots. The overall title is "Fraction of variance in centered and averaged activations explained by PCs." Each subplot shows the fraction of variance explained by the first 10 Principal Components (PCs) for different combinations of linguistic conditions or datasets. The data points are blue circles.
### Components/Axes
* **Main Title:** "Fraction of variance in centered and averaged activations explained by PCs"
* **Y-axis (Common to all plots):** "Explained variance". The scale ranges from 0.0 to approximately 0.7, with major ticks at 0.0, 0.2, 0.4, and 0.6.
* **X-axis (Common to all plots):** "PC index". The scale shows indices 1 through 10, with major ticks at 2, 4, 6, 8, and 10.
* **Subplot Titles (Positioned above each plot):**
1. Top-left: "affirmative"
2. Top-center: "affirmative, negated"
3. Top-right: "affirmative, negated, conjunctions"
4. Bottom-left: "affirmative, affirmative German"
5. Bottom-center: "affirmative, affirmative German, negated, negated German"
6. Bottom-right: "affirmative, negated, conjunctions, disjunctions"
### Detailed Analysis
Each plot follows a similar "scree plot" pattern: a high value for PC1, a sharp drop for PC2, followed by a gradual, near-exponential decay for subsequent PCs. Approximate values are extracted below.
**Plot 1 (Top-left: "affirmative")**
* PC1: ~0.70
* PC2: ~0.12
* PC3: ~0.08
* PC4: ~0.07
* PC5: ~0.02
* PC6: ~0.02
* PC7-10: ~0.00 (near zero)
**Plot 2 (Top-center: "affirmative, negated")**
* PC1: ~0.48
* PC2: ~0.22
* PC3: ~0.09
* PC4: ~0.06
* PC5: ~0.05
* PC6: ~0.04
* PC7: ~0.02
* PC8: ~0.02
* PC9: ~0.01
* PC10: ~0.01
**Plot 3 (Top-right: "affirmative, negated, conjunctions")**
* PC1: ~0.46
* PC2: ~0.20
* PC3: ~0.08
* PC4: ~0.06
* PC5: ~0.05
* PC6: ~0.04
* PC7: ~0.03
* PC8: ~0.02
* PC9: ~0.02
* PC10: ~0.01
**Plot 4 (Bottom-left: "affirmative, affirmative German")**
* PC1: ~0.66
* PC2: ~0.12
* PC3: ~0.07
* PC4: ~0.06
* PC5: ~0.02
* PC6: ~0.02
* PC7: ~0.02
* PC8: ~0.01
* PC9: ~0.01
* PC10: ~0.01
**Plot 5 (Bottom-center: "affirmative, affirmative German, negated, negated German")**
* PC1: ~0.45
* PC2: ~0.19
* PC3: ~0.10
* PC4: ~0.05
* PC5: ~0.05
* PC6: ~0.04
* PC7: ~0.02
* PC8: ~0.02
* PC9: ~0.01
* PC10: ~0.01
**Plot 6 (Bottom-right: "affirmative, negated, conjunctions, disjunctions")**
* PC1: ~0.44
* PC2: ~0.19
* PC3: ~0.08
* PC4: ~0.06
* PC5: ~0.05
* PC6: ~0.04
* PC7: ~0.03
* PC8: ~0.02
* PC9: ~0.02
* PC10: ~0.01
### Key Observations
1. **Universal Pattern:** All six plots exhibit the same fundamental trend: the first principal component (PC1) explains a disproportionately large fraction of the variance, followed by a steep drop to PC2, and then a gradual decline. This is characteristic of PCA on structured data.
2. **Variance Concentration:** PC1 alone explains between 44% and 70% of the variance across conditions. The first two PCs combined explain over 60% of the variance in all cases.
3. **Effect of Condition Complexity:** The "affirmative" only condition (Plot 1) shows the highest variance explained by PC1 (~70%). As more linguistic conditions are added (negation, conjunctions, disjunctions, German translations), the variance explained by PC1 decreases to the 44-48% range, suggesting the data becomes more complex and multidimensional.
4. **Similarity Across Complex Conditions:** Plots 2, 3, 5, and 6, which all include multiple conditions (e.g., affirmative+negated, or affirmative+negated+conjunctions), show remarkably similar scree shapes and values, indicating a consistent underlying structure when negation and logical connectives are involved.
### Interpretation
This analysis investigates the dimensionality of neural activation patterns corresponding to different linguistic constructs. The data suggests:
* **Low-Dimensional Core:** The activations for simple affirmative statements are highly structured and can be largely captured by a single dominant direction (PC1) in the activation space. This implies a strong, consistent neural representation for basic affirmative meaning.
* **Increased Dimensionality with Complexity:** Introducing negation, logical connectives (conjunctions/disjunctions), or cross-lingual (German) equivalents reduces the dominance of the first PC. This indicates that representing these more complex linguistic concepts requires activating additional, independent neural dimensions. The variance is "spread out" across more components.
* **Consistent Structure for Negation:** The plots involving negation (Plots 2, 3, 5, 6) are very similar. This hints that the neural computation for negation might follow a consistent, low-dimensional transformation relative to affirmative activations, regardless of whether it's combined with other constructs or presented in another language.
* **Practical Implication:** For tasks involving these linguistic phenomena, a relatively small number of principal components (e.g., the first 5-10) would be sufficient to capture the vast majority of the variance in the centered and averaged activation patterns, enabling effective dimensionality reduction.