## Scatter Plots: Fraction of Variance in Centered and Averaged Activations Explained by PCs
### Overview
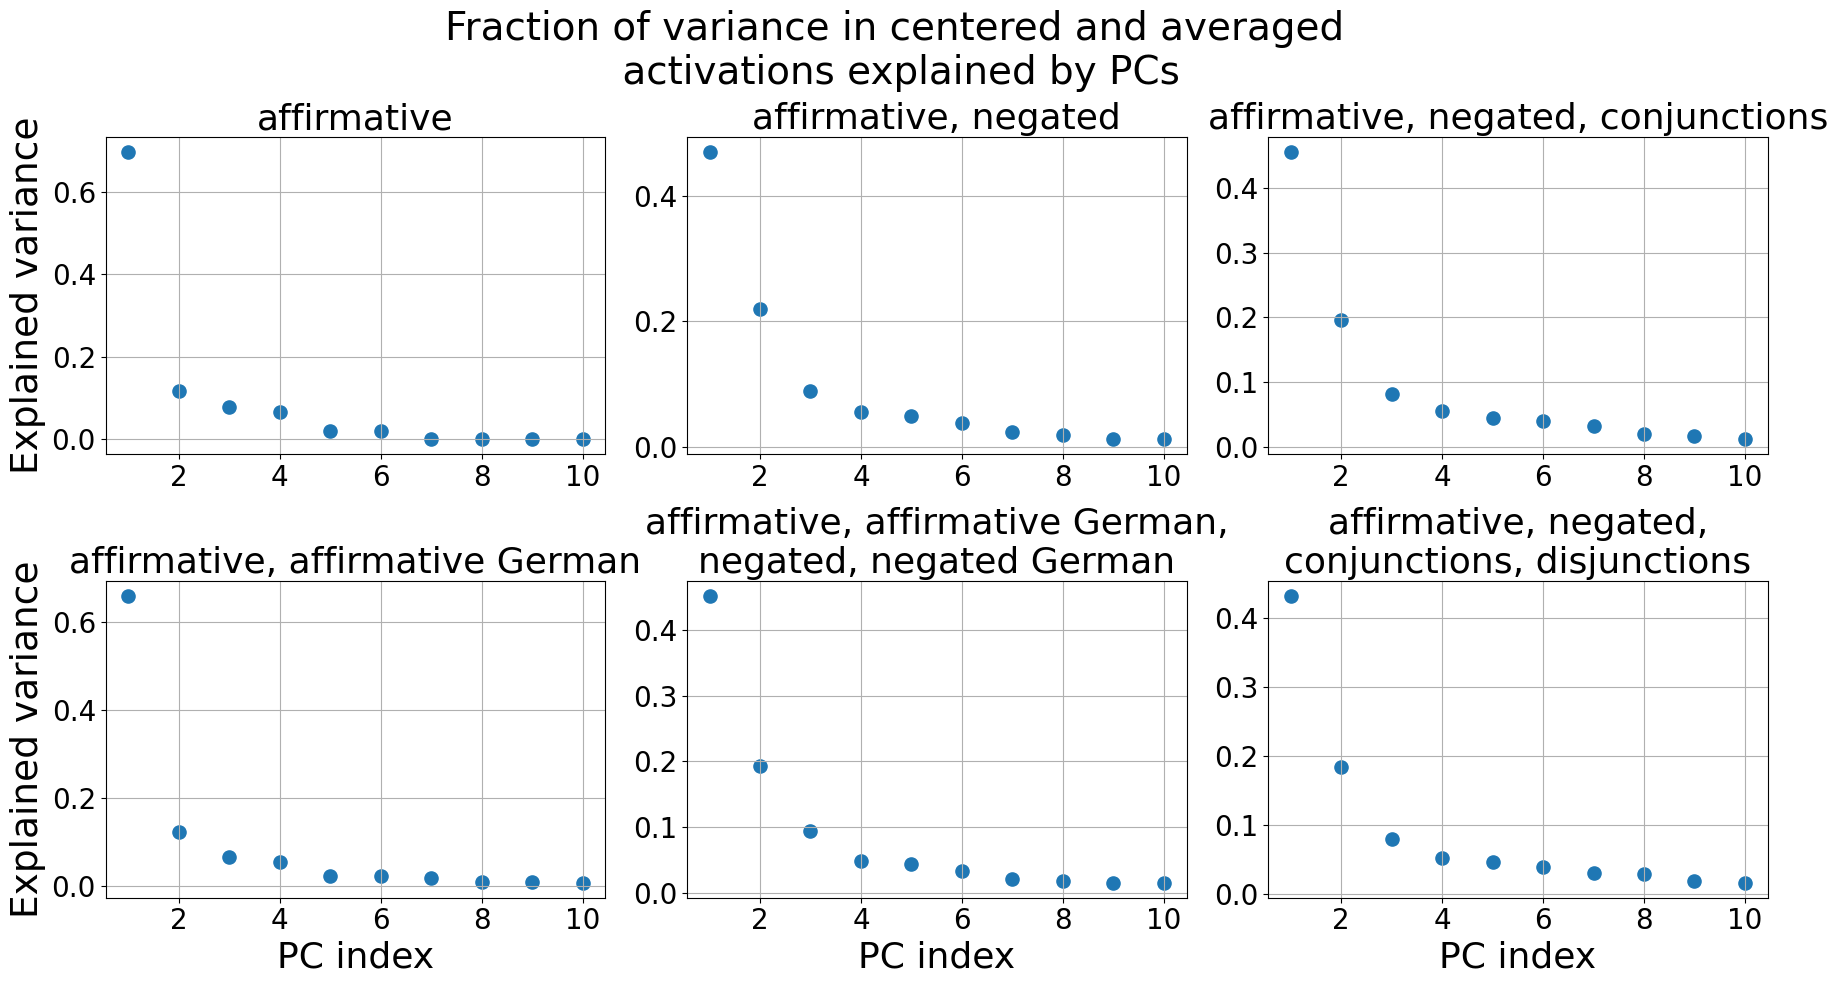
The image contains six scatter plots arranged in a 2x3 grid, each visualizing the relationship between principal component (PC) indices and explained variance for different linguistic feature combinations. All plots share identical axes but vary in their feature combinations, as indicated by their titles.
### Components/Axes
- **X-axis**: PC index (ranging from 1 to 10, labeled "PC index").
- **Y-axis**: Explained variance (ranging from 0 to 0.6, labeled "Explained variance").
- **Data Points**: Blue dots representing variance explained by each PC.
- **Plot Titles** (top row, left to right):
1. "affirmative"
2. "affirmative, negated"
3. "affirmative, negated, conjunctions"
- **Plot Titles** (bottom row, left to right):
4. "affirmative, affirmative German"
5. "affirmative, affirmative German, negated, negated German"
6. "affirmative, negated, conjunctions, disjunctions"
### Detailed Analysis
#### Plot 1: "affirmative"
- **Trend**: Sharp decline in explained variance after PC1.
- **Key Data Points**:
- PC1: ~0.65
- PC2: ~0.12
- PC3–PC10: <0.02
#### Plot 2: "affirmative, negated"
- **Trend**: Gradual decline after PC1.
- **Key Data Points**:
- PC1: ~0.45
- PC2: ~0.20
- PC3: ~0.10
- PC4–PC10: <0.05
#### Plot 3: "affirmative, negated, conjunctions"
- **Trend**: Steeper drop-off after PC1.
- **Key Data Points**:
- PC1: ~0.35
- PC2: ~0.15
- PC3: ~0.08
- PC4–PC10: <0.03
#### Plot 4: "affirmative, affirmative German"
- **Trend**: Dominance of PC1 with rapid decay.
- **Key Data Points**:
- PC1: ~0.60
- PC2: ~0.10
- PC3–PC10: <0.02
#### Plot 5: "affirmative, affirmative German, negated, negated German"
- **Trend**: Moderate variance spread across first three PCs.
- **Key Data Points**:
- PC1: ~0.30
- PC2: ~0.15
- PC3: ~0.10
- PC4–PC10: <0.04
#### Plot 6: "affirmative, negated, conjunctions, disjunctions"
- **Trend**: Gradual decline with moderate variance in early PCs.
- **Key Data Points**:
- PC1: ~0.40
- PC2: ~0.20
- PC3: ~0.10
- PC4: ~0.08
- PC5–PC10: <0.03
### Key Observations
1. **Dominance of PC1**: Across all plots, PC1 consistently explains the largest fraction of variance, though the magnitude decreases as more linguistic features are added.
2. **Feature Complexity**: Adding negation, conjunctions, and disjunctions reduces the variance explained by PC1 (e.g., from ~0.65 in Plot 1 to ~0.30 in Plot 5).
3. **German-Specific Trends**: Plots involving German ("affirmative German") show slightly lower variance in PC1 compared to their non-German counterparts, suggesting language-specific structural differences.
4. **Diminishing Returns**: Later PCs (PC4–PC10) contribute minimally (<0.05) to explained variance in most cases.
### Interpretation
The data suggests that the first principal component captures the most significant variation in linguistic feature distributions, likely tied to core syntactic structures (e.g., affirmative clauses). As additional features (negation, conjunctions) are introduced, the variance becomes more distributed across PCs, indicating increased complexity in the data. The German-specific plots highlight subtle differences in how these features interact, possibly reflecting typological or syntactic distinctions in the language. The rapid decay of variance after PC1–PC3 underscores the dominance of a few principal components in explaining the majority of variation, a common pattern in principal component analysis (PCA).