## [Chart]: Shannon and Bayesian Surprise vs. Number of Exploitations
### Overview
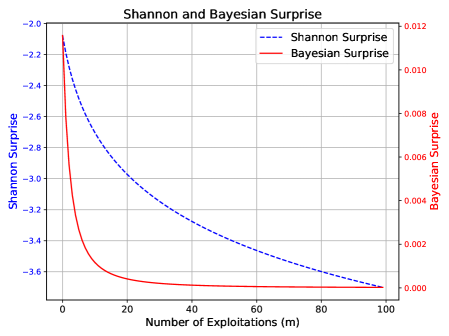
The image is a dual-axis line chart titled "Shannon and Bayesian Surprise". It plots two different metrics of "surprise" against the "Number of Exploitations (m)". The chart demonstrates how both metrics decrease as the number of exploitations increases, but at significantly different rates and scales.
### Components/Axes
* **Title:** "Shannon and Bayesian Surprise" (centered at the top).
* **X-Axis:**
* **Label:** "Number of Exploitations (m)" (centered at the bottom).
* **Scale:** Linear, ranging from 0 to 100.
* **Major Tick Marks:** 0, 20, 40, 60, 80, 100.
* **Primary Y-Axis (Left):**
* **Label:** "Shannon Surprise" (rotated vertically, left side).
* **Scale:** Linear, with negative values.
* **Range:** Approximately -2.0 to -3.6.
* **Major Tick Marks:** -2.0, -2.2, -2.4, -2.6, -2.8, -3.0, -3.2, -3.4, -3.6.
* **Secondary Y-Axis (Right):**
* **Label:** "Bayesian Surprise" (rotated vertically, right side).
* **Scale:** Linear, with positive values.
* **Range:** 0.000 to 0.012.
* **Major Tick Marks:** 0.000, 0.002, 0.004, 0.006, 0.008, 0.010, 0.012.
* **Legend:**
* **Position:** Top-right corner, inside the plot area.
* **Entry 1:** Blue dashed line (`--`) labeled "Shannon Surprise".
* **Entry 2:** Red solid line (`-`) labeled "Bayesian Surprise".
* **Grid:** A light gray grid is present for both axes.
### Detailed Analysis
**1. Shannon Surprise (Blue Dashed Line):**
* **Trend:** The line shows a steady, monotonic decrease (negative slope) across the entire range. The rate of decrease slows slightly as `m` increases.
* **Data Points (Approximate):**
* At m=0: ~ -2.1
* At m=20: ~ -2.9
* At m=40: ~ -3.2
* At m=60: ~ -3.4
* At m=80: ~ -3.5
* At m=100: ~ -3.6
**2. Bayesian Surprise (Red Solid Line):**
* **Trend:** The line exhibits a very sharp, exponential-like decay initially, followed by a rapid plateau. The value approaches zero asymptotically.
* **Data Points (Approximate):**
* At m=0: ~ 0.011
* At m=5: ~ 0.004
* At m=10: ~ 0.001
* At m=20: ~ 0.0002
* At m=40 to m=100: The value is visually indistinguishable from 0.000 on this scale.
### Key Observations
* **Scale Disparity:** The two metrics operate on vastly different scales. Shannon Surprise is measured in negative units (likely bits, given the name), while Bayesian Surprise is a small positive number.
* **Rate of Change:** Bayesian Surprise diminishes to near-zero within the first 20 exploitations. Shannon Surprise continues to decrease meaningfully across the full range of 100 exploitations.
* **Convergence:** Both lines appear to converge towards a lower bound as `m` increases, but the Bayesian metric reaches its effective floor much sooner.
### Interpretation
This chart likely illustrates concepts from information theory and Bayesian statistics in the context of an exploration-exploitation process (e.g., in reinforcement learning or active learning).
* **What it Suggests:** The "surprise" associated with new information decreases as more data is gathered (exploitations increase). The chart quantitatively compares two ways of measuring this surprise.
* **Relationship Between Elements:** The dual-axis format is necessary because the fundamental units and magnitudes of the two metrics are different. The shared x-axis allows for direct comparison of their behavior relative to the same process variable (`m`).
* **Notable Patterns:**
1. **Bayesian Surprise is "Front-Loaded":** It captures almost all of its informational value very early in the process. This suggests it is highly sensitive to initial, novel data and quickly becomes uninformative as the model's beliefs stabilize.
2. **Shannon Surprise has "Long-Tail" Information:** It continues to register decreasing surprise over many more steps, indicating it may be measuring a more persistent form of uncertainty or information gain that diminishes gradually.
3. **The Plateau:** The flatlining of the Bayesian Surprise curve after m≈40 indicates that, according to this metric, virtually no new, surprising information is being obtained from additional exploitations beyond that point. The Shannon metric, however, still registers a (small) decrease, implying some residual uncertainty is still being resolved.
**In summary, the chart demonstrates that while both metrics capture the reduction of uncertainty with experience, Bayesian Surprise is a more rapidly saturating measure, whereas Shannon Surprise provides a more prolonged signal of decreasing uncertainty.**