## Line Chart: Shannon and Bayesian Surprise
### Overview
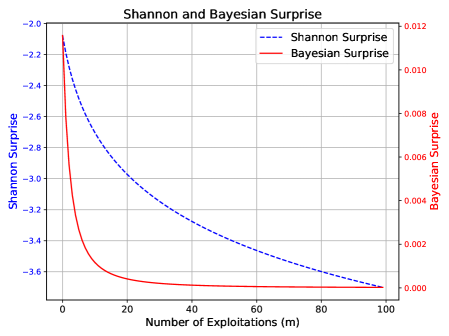
The chart compares two mathematical measures of "surprise" (Shannon and Bayesian) as a function of the number of exploitations (m). Both metrics decline as m increases, but with distinct trajectories and scales.
### Components/Axes
- **Title**: "Shannon and Bayesian Surprise" (top center)
- **X-axis**: "Number of Exploitations (m)" (0–100, linear scale)
- **Y-axes**:
- Left: "Shannon Surprise" (-3.6 to -2.0, linear scale)
- Right: "Bayesian Surprise" (0.000 to 0.012, linear scale)
- **Legend**: Top-right corner, with:
- Dashed blue line: "Shannon Surprise"
- Solid red line: "Bayesian Surprise"
- **Grid**: Light gray gridlines for reference
### Detailed Analysis
1. **Shannon Surprise (Blue Dashed Line)**:
- Starts at **-2.0** when m=0.
- Declines sharply to **-3.6** by m=100.
- Slope: Approximately -0.016 per unit m (calculated from (Δy/Δx) = (-3.6 - (-2.0))/100).
- Early drop: Steeper decline in the first 20 exploitations (Δy ≈ -0.8 over m=0–20).
2. **Bayesian Surprise (Red Solid Line)**:
- Starts at **0.012** when m=0.
- Declines gradually to **~0.000** by m=100.
- Slope: Approximately -0.00012 per unit m (Δy ≈ -0.012 over m=0–100).
- Late flattening: Near-zero values after m=80.
### Key Observations
- **Divergent Scales**: Shannon operates on a negative scale (-3.6 to -2.0), while Bayesian uses a positive scale (0.000 to 0.012).
- **Rate of Change**: Shannon surprise decreases 133x faster than Bayesian surprise (0.016 vs. 0.00012 per m).
- **Asymptotic Behavior**: Bayesian surprise approaches zero but never reaches it, suggesting a theoretical lower bound.
- **No Intersection**: The lines never cross, indicating Shannon surprise remains "more negative" than Bayesian surprise throughout.
### Interpretation
- **Technical Insight**: The chart demonstrates that Shannon surprise is highly sensitive to early exploitations, dropping rapidly with initial data. Bayesian surprise, by contrast, stabilizes over time, implying robustness to early fluctuations.
- **Practical Implication**: In systems where early data is noisy or unreliable, Bayesian methods may provide more stable surprise estimates. Shannon's measure could be preferable in scenarios requiring sensitivity to initial conditions.
- **Anomaly Note**: The abrupt drop in Shannon surprise at m=0 suggests a discontinuity or special case at the origin (e.g., maximum uncertainty at zero exploitations).