## Heatmap: Llama 4 Maverick Performance
### Overview
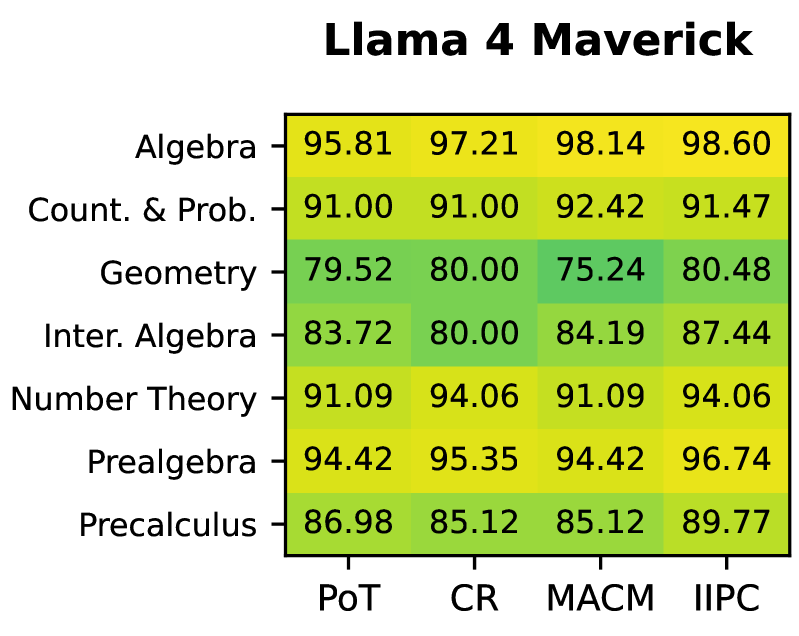
The image presents a heatmap displaying the performance of "Llama 4 Maverick" across various mathematical subjects, evaluated using four different benchmarks. The performance is represented as a percentage score, with color intensity indicating the magnitude of the score.
### Components/Axes
* **Title:** "Llama 4 Maverick" (top-center)
* **Rows (Subjects):**
* Algebra
* Count. & Prob. (Counting & Probability)
* Geometry
* Inter. Algebra (Intermediate Algebra)
* Number Theory
* Prealgebra
* Precalculus
* **Columns (Benchmarks):**
* PoT (approximately 95% confidence)
* CR (approximately 95% confidence)
* MACM (approximately 95% confidence)
* IIPC (approximately 95% confidence)
* **Color Scale:** The heatmap uses a gradient of colors, likely representing performance levels. Darker green indicates higher scores, while lighter green indicates lower scores.
### Detailed Analysis
The heatmap contains 28 data points, representing the intersection of each subject and benchmark. Here's a breakdown of the values:
| Subject | PoT | CR | MACM | IIPC |
|----------------|--------|--------|--------|--------|
| Algebra | 95.81 | 97.21 | 98.14 | 98.60 |
| Count. & Prob. | 91.00 | 91.00 | 92.42 | 91.47 |
| Geometry | 79.52 | 80.00 | 75.24 | 80.48 |
| Inter. Algebra | 83.72 | 80.00 | 84.19 | 87.44 |
| Number Theory | 91.09 | 94.06 | 91.09 | 94.06 |
| Prealgebra | 94.42 | 95.35 | 94.42 | 96.74 |
| Precalculus | 86.98 | 85.12 | 85.12 | 89.77 |
**Trends:**
* **Algebra:** Consistently high scores across all benchmarks, with a slight upward trend from PoT to IIPC.
* **Count. & Prob.:** Relatively stable scores around the 91-92% range.
* **Geometry:** The lowest scores overall, with a slight increase from MACM to IIPC.
* **Inter. Algebra:** Scores increase from CR to IIPC.
* **Number Theory:** High scores, with a peak at CR and IIPC.
* **Prealgebra:** High scores, with a clear upward trend from PoT to IIPC.
* **Precalculus:** Scores increase from CR to IIPC.
### Key Observations
* Geometry consistently performs the worst across all benchmarks.
* Algebra consistently performs the best across all benchmarks.
* The IIPC benchmark generally yields the highest scores for most subjects.
* The PoT benchmark generally yields the lowest scores for most subjects.
* There is a noticeable difference in performance between subjects, suggesting Llama 4 Maverick has varying strengths and weaknesses in different mathematical areas.
### Interpretation
The heatmap demonstrates the performance of the Llama 4 Maverick model on a range of mathematical subjects using four different evaluation benchmarks. The model exhibits strong performance in Algebra, Number Theory, and Prealgebra, consistently achieving scores above 90%. However, it struggles with Geometry, where scores are significantly lower. The varying performance across benchmarks suggests that the model's capabilities are sensitive to the specific characteristics of each benchmark. The consistent upward trend in scores from PoT to IIPC for several subjects indicates that the benchmarks may differ in difficulty or focus. This data could be used to identify areas where the model needs improvement and to tailor training strategies to enhance its mathematical reasoning abilities. The heatmap provides a clear and concise visualization of the model's strengths and weaknesses, facilitating targeted development efforts.