## Heatmap: Llama 4 Maverick Performance Across Math Categories and Evaluation Methods
### Overview
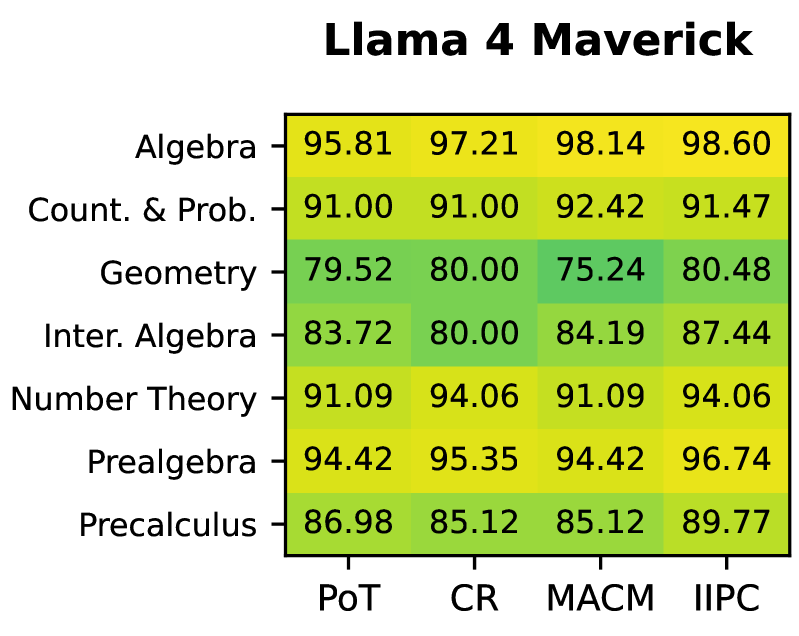
This image is a heatmap titled "Llama 4 Maverick," displaying the performance scores (presumably percentages) of an AI model named "Llama 4 Maverick" across seven mathematical categories and four different evaluation methods. The performance is visualized using a color gradient from green (lower scores) to yellow (higher scores).
### Components/Axes
* **Title:** "Llama 4 Maverick" (centered at the top).
* **Row Labels (Y-axis - Math Categories):** Listed vertically on the left side. From top to bottom:
1. Algebra
2. Count. & Prob. (Counting & Probability)
3. Geometry
4. Inter. Algebra (Intermediate Algebra)
5. Number Theory
6. Prealgebra
7. Precalculus
* **Column Labels (X-axis - Evaluation Methods):** Listed horizontally at the bottom. From left to right:
1. PoT
2. CR
3. MACM
4. IIPC
* **Data Grid:** A 7x4 grid of colored cells, each containing a numerical score.
* **Color Scale/Legend:** A gradient bar is not explicitly shown, but the cells themselves form a visual legend. Colors range from a darker green (associated with lower scores, e.g., 75.24) to a bright yellow (associated with higher scores, e.g., 98.60). The legend is implicitly embedded in the data grid's color mapping.
### Detailed Analysis
**Data Table Reconstruction:**
The following table lists all extracted scores. Rows represent Math Categories, and columns represent Evaluation Methods.
| Math Category | PoT | CR | MACM | IIPC |
|--------------------|--------|--------|--------|--------|
| Algebra | 95.81 | 97.21 | 98.14 | 98.60 |
| Count. & Prob. | 91.00 | 91.00 | 92.42 | 91.47 |
| Geometry | 79.52 | 80.00 | 75.24 | 80.48 |
| Inter. Algebra | 83.72 | 80.00 | 84.19 | 87.44 |
| Number Theory | 91.09 | 94.06 | 91.09 | 94.06 |
| Prealgebra | 94.42 | 95.35 | 94.42 | 96.74 |
| Precalculus | 86.98 | 85.12 | 85.12 | 89.77 |
**Trend Verification & Color Correlation:**
* **Algebra:** Scores are consistently high (95.81 to 98.60), represented by bright yellow cells. The trend is slightly upward from PoT to IIPC.
* **Count. & Prob.:** Scores are stable in the low 90s (91.00 to 92.42), shown in yellow-green.
* **Geometry:** Scores are the lowest overall (75.24 to 80.48), represented by the darkest green cells. The MACM score (75.24) is a notable low point.
* **Inter. Algebra:** Scores are in the mid-80s (80.00 to 87.44), shown in green to yellow-green. There is a dip at CR (80.00).
* **Number Theory:** Scores are in the low-to-mid 90s (91.09 to 94.06), shown in yellow-green. PoT and MACM have identical scores (91.09), as do CR and IIPC (94.06).
* **Prealgebra:** Scores are high (94.42 to 96.74), shown in yellow. PoT and MACM have identical scores (94.42).
* **Precalculus:** Scores are in the mid-to-high 80s (85.12 to 89.77), shown in green to yellow-green. CR and MACM have identical scores (85.12).
### Key Observations
1. **Category Performance Spread:** There is a significant performance gap between categories. Algebra is the strongest (peak: 98.60), while Geometry is the weakest (low: 75.24).
2. **Evaluation Method Consistency:** The IIPC method generally yields the highest or tied-for-highest scores in 6 out of 7 categories (all except Count. & Prob., where it is second). The CR method often yields the lowest or tied-for-lowest scores.
3. **Identical Scores:** Several pairs of identical scores appear across different evaluation methods for the same category (e.g., Number Theory: PoT=MACM=91.09; Precalculus: CR=MACM=85.12).
4. **Color Gradient Accuracy:** The color coding accurately reflects the numerical values. The brightest yellow cells correspond to the highest scores (e.g., Algebra-IIPC: 98.60), and the darkest green cells correspond to the lowest scores (e.g., Geometry-MACM: 75.24).
### Interpretation
This heatmap provides a comparative performance analysis of the "Llama 4 Maverick" model. The data suggests the model has a strong grasp of foundational and algebraic mathematics (Algebra, Prealgebra, Number Theory) but struggles more with spatial and geometric reasoning (Geometry). The performance in Intermediate Algebra and Precalculus is moderate.
The variation across evaluation methods (PoT, CR, MACM, IIPC) indicates that the model's measured proficiency is sensitive to the testing framework. The IIPC method appears to be the most favorable for this model, while CR and MACM are often more challenging. The presence of identical scores across methods for certain categories might suggest a performance ceiling or a specific limitation in the model's understanding of those topics that different evaluation techniques are equally unable to probe beyond.
**Language Declaration:** All text in the image is in English.