## Heatmap: Llama 4 Maverick Performance Scores
### Overview
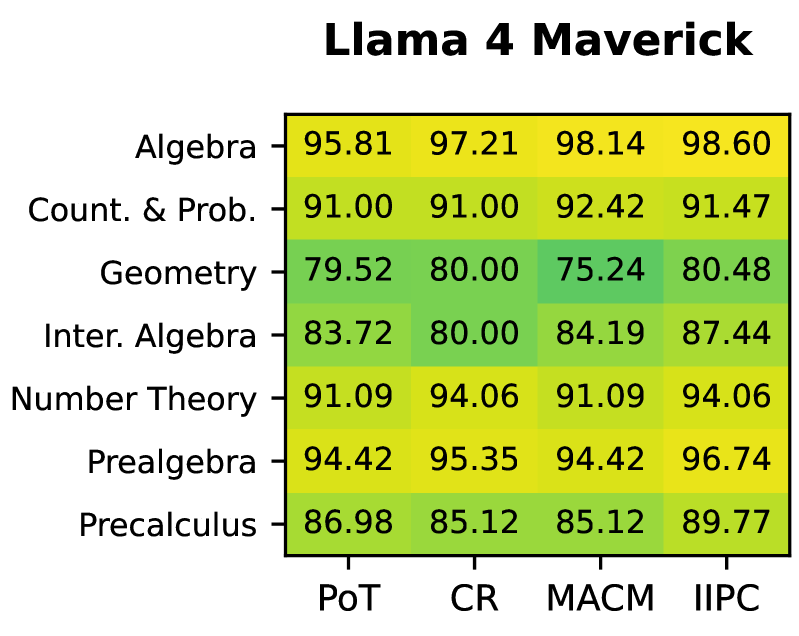
The image displays a heatmap titled "Llama 4 Maverick" comparing performance scores across seven academic subjects and four assessment types. Scores are represented as percentages (0-100%) with a color gradient from green (lower values) to yellow (higher values). The data suggests varying proficiency levels across subjects and assessments.
### Components/Axes
- **X-axis (Columns)**: Assessment types labeled "PoT," "CR," "MACM," and "IIPC."
- **Y-axis (Rows)**: Academic subjects: "Algebra," "Count. & Prob.," "Geometry," "Inter. Algebra," "Number Theory," "Prealgebra," and "Precalculus."
- **Color Legend**: Implied gradient from green (low scores) to yellow (high scores), with no explicit legend box.
- **Values**: Numerical percentages embedded in each cell, formatted to two decimal places.
### Detailed Analysis
#### Subject Performance
1. **Algebra**
- Scores: 95.81 (PoT), 97.21 (CR), 98.14 (MACM), 98.60 (IIPC)
- Trend: Consistently high performance, peaking in MACM and IIPC.
- Color: Bright yellow across all assessments.
2. **Count. & Prob.**
- Scores: 91.00 (PoT), 91.00 (CR), 92.42 (MACM), 91.47 (IIPC)
- Trend: Stable with a slight increase in MACM.
- Color: Yellow-green gradient.
3. **Geometry**
- Scores: 79.52 (PoT), 80.00 (CR), 75.24 (MACM), 80.48 (IIPC)
- Trend: Lowest scores overall, with a dip in MACM.
- Color: Green to light green.
4. **Inter. Algebra**
- Scores: 83.72 (PoT), 80.00 (CR), 84.19 (MACM), 87.44 (IIPC)
- Trend: Improvement from CR to IIPC.
- Color: Light green to yellow.
5. **Number Theory**
- Scores: 91.09 (PoT), 94.06 (CR), 91.09 (MACM), 94.06 (IIPC)
- Trend: Fluctuating but high, with peaks in CR and IIPC.
- Color: Yellow-green.
6. **Prealgebra**
- Scores: 94.42 (PoT), 95.35 (CR), 94.42 (MACM), 96.74 (IIPC)
- Trend: Slight upward trajectory.
- Color: Yellow.
7. **Precalculus**
- Scores: 86.98 (PoT), 85.12 (CR), 85.12 (MACM), 89.77 (IIPC)
- Trend: Decline from PoT to CR/MACM, then recovery in IIPC.
- Color: Green to yellow.
### Key Observations
- **High Performers**: Algebra and Number Theory dominate, with scores above 90% in most assessments.
- **Low Performers**: Geometry consistently scores below 80%, with MACM at 75.24 (lowest in the table).
- **Improvement Trends**:
- Prealgebra and Inter. Algebra show growth from CR to IIPC.
- Precalculus rebounds in IIPC after dipping in CR/MACM.
- **Color Consistency**: Yellow dominates high-performing subjects, while green indicates weaker areas (e.g., Geometry).
### Interpretation
The heatmap reveals subject-specific strengths and weaknesses. Algebra and Number Theory demonstrate mastery, suggesting robust curricular focus or student aptitude. Geometry’s low scores, particularly in MACM, highlight a potential gap in spatial reasoning or foundational skills. The color gradient effectively visualizes performance disparities, with yellow clusters indicating mastery and green clusters signaling areas needing intervention. Precalculus’s recovery in IIPC suggests targeted improvements may yield positive results. The data underscores the need for differentiated instruction, particularly for Geometry and Precalculus, to address systemic weaknesses.