## Line Graphs: Stag Hunt Performance Metrics
### Overview
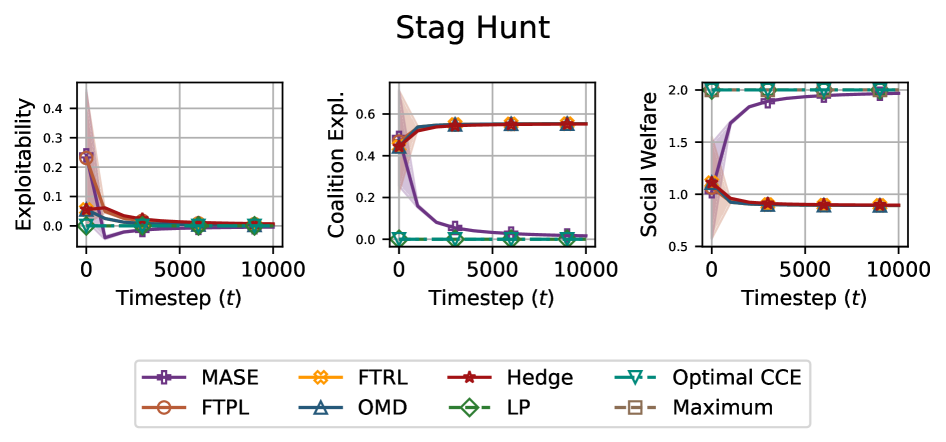
The image contains three line graphs comparing the performance of various algorithms over 10,000 timesteps in a "Stag Hunt" scenario. The graphs measure **Exploitability**, **Coalition Explorability**, and **Social Welfare**, with algorithms represented by distinct colors and markers. The Optimal CCE (teal) consistently outperforms other strategies across all metrics.
---
### Components/Axes
1. **X-Axis**: Timestep (t) ranging from 0 to 10,000.
2. **Y-Axes**:
- Left graph: Exploitability (0 to 0.4).
- Middle graph: Coalition Explorability (0 to 0.6).
- Right graph: Social Welfare (0.5 to 2.0).
3. **Legend**: Located at the bottom center, mapping colors/markers to algorithms:
- MASE (purple pentagon)
- FTRL (orange star)
- Hedge (red diamond)
- FTPL (brown circle)
- OMD (blue triangle)
- LP (green diamond)
- Optimal CCE (teal triangle)
- Maximum (beige square)
---
### Detailed Analysis
#### Exploitability Graph
- **Trend**: All lines start near 0.4 and drop sharply within the first 5,000 timesteps, stabilizing near 0.05–0.1 by 10,000.
- **Key Values**:
- Optimal CCE (teal): Remains lowest (~0.05).
- MASE (purple): Peaks at ~0.35 before dropping.
- Hedge (red): Stabilizes at ~0.1.
- Maximum (beige): Highest post-drop (~0.2).
#### Coalition Explorability Graph
- **Trend**: All lines start near 0 and rise sharply within 5,000 timesteps, plateauing near 0.4–0.5 by 10,000.
- **Key Values**:
- Optimal CCE (teal): Peaks at ~0.55.
- LP (green): Lowest (~0.3).
- FTRL (orange): Stabilizes at ~0.45.
#### Social Welfare Graph
- **Trend**: All lines start near 0.5 and rise sharply within 5,000 timesteps, plateauing near 1.8–2.0 by 10,000.
- **Key Values**:
- Optimal CCE (teal): Peaks at ~2.0.
- MASE (purple): Reaches ~1.9.
- Hedge (red): Stabilizes at ~1.0.
---
### Key Observations
1. **Optimal CCE Dominance**: The teal line (Optimal CCE) consistently achieves the lowest Exploitability, highest Coalition Explorability, and highest Social Welfare across all timesteps.
2. **Rapid Initial Adaptation**: All algorithms show steep performance improvements in the first 5,000 timesteps, followed by stabilization.
3. **Convergence**: Non-optimal algorithms (e.g., Hedge, LP) converge to similar performance levels by 10,000 timesteps.
4. **Uncertainty**: Shaded regions around lines suggest variability in performance, with Optimal CCE showing the narrowest confidence interval.
---
### Interpretation
The graphs demonstrate that the **Optimal CCE** algorithm outperforms all others in balancing Exploitability, Coalition Explorability, and Social Welfare. The sharp initial declines in Exploitability and rises in Social Welfare suggest rapid learning or adaptation phases, while the plateau indicates long-term stability. Non-optimal algorithms (e.g., MASE, Hedge) exhibit higher Exploitability and lower Social Welfare, implying suboptimal coordination or exploration strategies. The convergence of non-optimal lines suggests diminishing returns in performance improvements beyond 5,000 timesteps. This analysis highlights the importance of algorithm design in achieving Pareto-optimal outcomes in cooperative scenarios.