## Line Chart: Accuracy vs. Difficulty Level for Different Models
### Overview
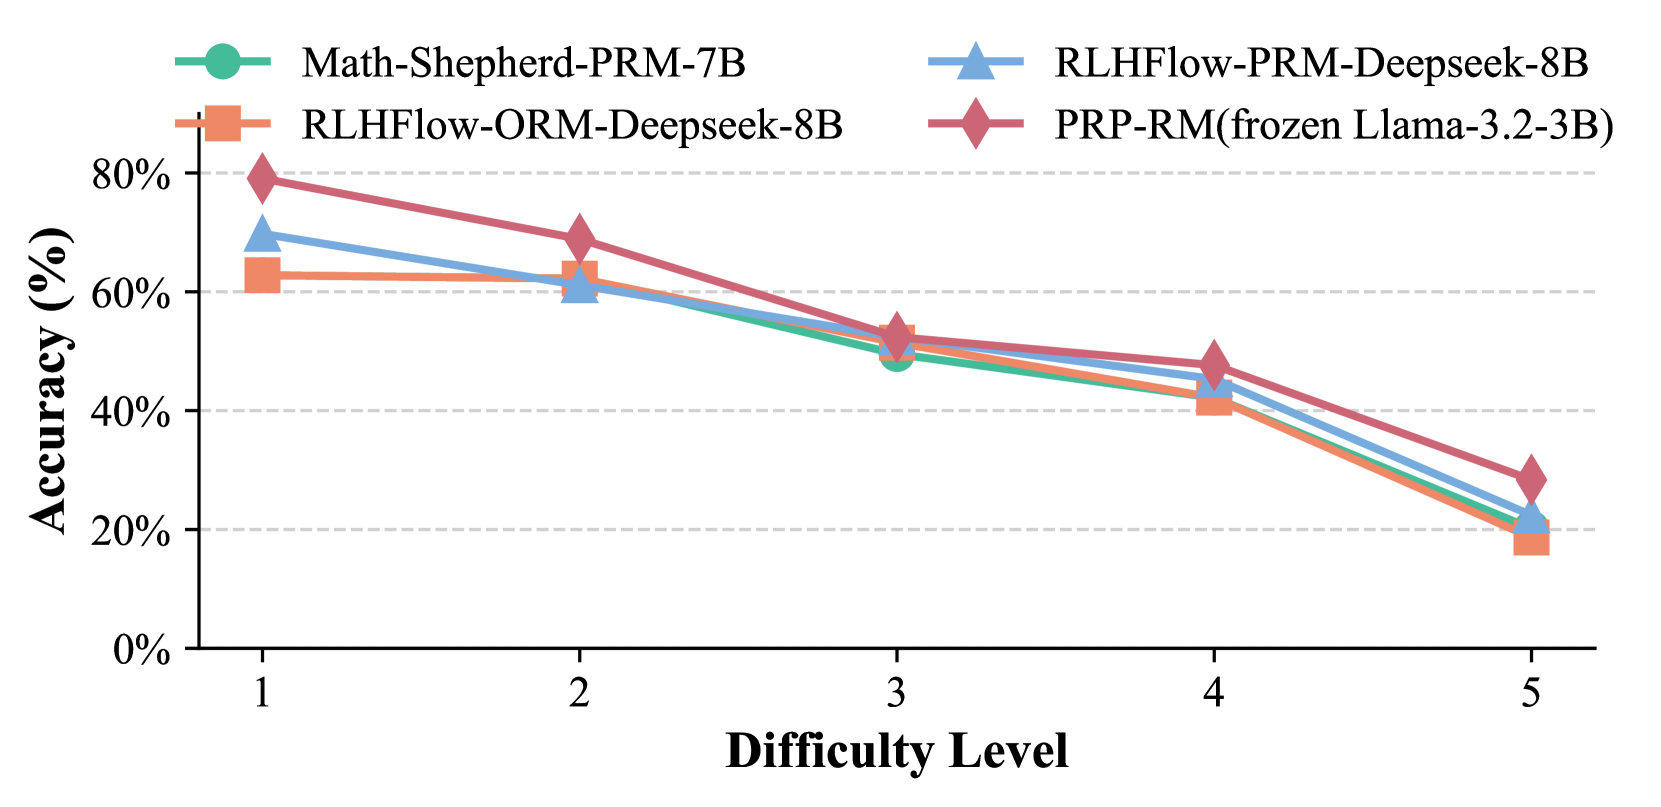
This image displays a line chart illustrating the accuracy of four different models across five difficulty levels. The chart shows a general downward trend in accuracy as the difficulty level increases for all models.
### Components/Axes
* **Title**: Implicitly, the chart title is "Accuracy vs. Difficulty Level for Different Models".
* **Y-axis**:
* **Label**: "Accuracy (%)"
* **Scale**: Ranges from 0% to 80%, with major tick marks at 0%, 20%, 40%, 60%, and 80%. Minor dashed grid lines are present at 10% intervals.
* **X-axis**:
* **Label**: "Difficulty Level"
* **Scale**: Ranges from 1 to 5, with major tick marks at 1, 2, 3, 4, and 5.
* **Legend**: Located in the top-center of the chart, it defines the four data series and their corresponding markers and colors:
* **Math-Shepherd-PRM-7B**: Teal line with circular markers.
* **RLHFlow-ORM-Deepseek-8B**: Orange line with square markers.
* **RLHFlow-PRM-Deepseek-8B**: Blue line with triangular markers.
* **PRP-RM(frozen Llama-3.2-3B)**: Red line with diamond markers.
### Detailed Analysis
The chart presents data points for each model at Difficulty Levels 1 through 5.
**1. Math-Shepherd-PRM-7B (Teal, Circle Markers)**
* **Trend**: The accuracy generally decreases as the difficulty level increases.
* **Data Points (approximate values with uncertainty +/- 2%)**:
* Difficulty Level 1: 68%
* Difficulty Level 2: 55%
* Difficulty Level 3: 50%
* Difficulty Level 4: 45%
* Difficulty Level 5: 20%
**2. RLHFlow-ORM-Deepseek-8B (Orange, Square Markers)**
* **Trend**: The accuracy generally decreases as the difficulty level increases.
* **Data Points (approximate values with uncertainty +/- 2%)**:
* Difficulty Level 1: 63%
* Difficulty Level 2: 62%
* Difficulty Level 3: 52%
* Difficulty Level 4: 41%
* Difficulty Level 5: 19%
**3. RLHFlow-PRM-Deepseek-8B (Blue, Triangle Markers)**
* **Trend**: The accuracy generally decreases as the difficulty level increases.
* **Data Points (approximate values with uncertainty +/- 2%)**:
* Difficulty Level 1: 70%
* Difficulty Level 2: 60%
* Difficulty Level 3: 50%
* Difficulty Level 4: 45%
* Difficulty Level 5: 21%
**4. PRP-RM(frozen Llama-3.2-3B) (Red, Diamond Markers)**
* **Trend**: The accuracy generally decreases as the difficulty level increases.
* **Data Points (approximate values with uncertainty +/- 2%)**:
* Difficulty Level 1: 79%
* Difficulty Level 2: 65%
* Difficulty Level 3: 54%
* Difficulty Level 4: 42%
* Difficulty Level 5: 29%
### Key Observations
* **Overall Trend**: All four models exhibit a consistent decline in accuracy as the difficulty level increases from 1 to 5.
* **Highest Accuracy at Difficulty 1**: The PRP-RM(frozen Llama-3.2-3B) model shows the highest accuracy (approximately 79%) at the easiest difficulty level (1).
* **Lowest Accuracy at Difficulty 5**: At the highest difficulty level (5), all models perform poorly, with accuracies ranging from approximately 19% to 29%.
* **Model Performance Comparison**:
* At Difficulty Level 1, PRP-RM(frozen Llama-3.2-3B) is the best performer, followed closely by RLHFlow-PRM-Deepseek-8B.
* At Difficulty Level 2, RLHFlow-ORM-Deepseek-8B shows a slight dip but remains relatively high, while Math-Shepherd-PRM-7B and RLHFlow-PRM-Deepseek-8B are similar. PRP-RM(frozen Llama-3.2-3B) is still leading.
* From Difficulty Level 3 onwards, the performance of Math-Shepherd-PRM-7B and RLHFlow-PRM-Deepseek-8B becomes very similar, often overlapping.
* RLHFlow-ORM-Deepseek-8B consistently shows slightly lower accuracy than Math-Shepherd-PRM-7B and RLHFlow-PRM-Deepseek-8B from Difficulty Level 3 onwards.
* PRP-RM(frozen Llama-3.2-3B) maintains a lead over the other models until Difficulty Level 4, after which it shows a significant drop in accuracy at Difficulty Level 5, becoming the second-best performer at that level, just above RLHFlow-ORM-Deepseek-8B.
### Interpretation
This chart demonstrates the impact of increasing difficulty on the performance of different language models. The general downward trend suggests that as tasks become more complex, the models' ability to accurately solve them diminishes.
The variation in performance across models at different difficulty levels is notable. PRP-RM(frozen Llama-3.2-3B) appears to be the most robust at lower difficulty levels, indicating a strong initial capability. However, its performance degrades significantly at higher difficulties, suggesting it might be less adaptable to complex challenges compared to some other models.
Conversely, models like Math-Shepherd-PRM-7B and RLHFlow-PRM-Deepseek-8B show a more gradual decline, indicating a potentially more consistent performance across a wider range of difficulties, although their peak performance is lower than PRP-RM. RLHFlow-ORM-Deepseek-8B consistently lags slightly behind the others, particularly at higher difficulty levels, suggesting it might be the least effective of the four models presented in this context.
The data implies that model selection for tasks involving varying difficulty levels should consider not only peak performance but also performance degradation under stress. For tasks with a high likelihood of encountering complex problems, models with a more stable performance curve (like Math-Shepherd-PRM-7B or RLHFlow-PRM-Deepseek-8B) might be preferable over those that excel at easy tasks but falter significantly at hard ones (like PRP-RM). The sharp drop in accuracy for all models at Difficulty Level 5 highlights a common limitation in current AI models when faced with extremely challenging problems.