## Line Graph: Model Accuracy Across Difficulty Levels
### Overview
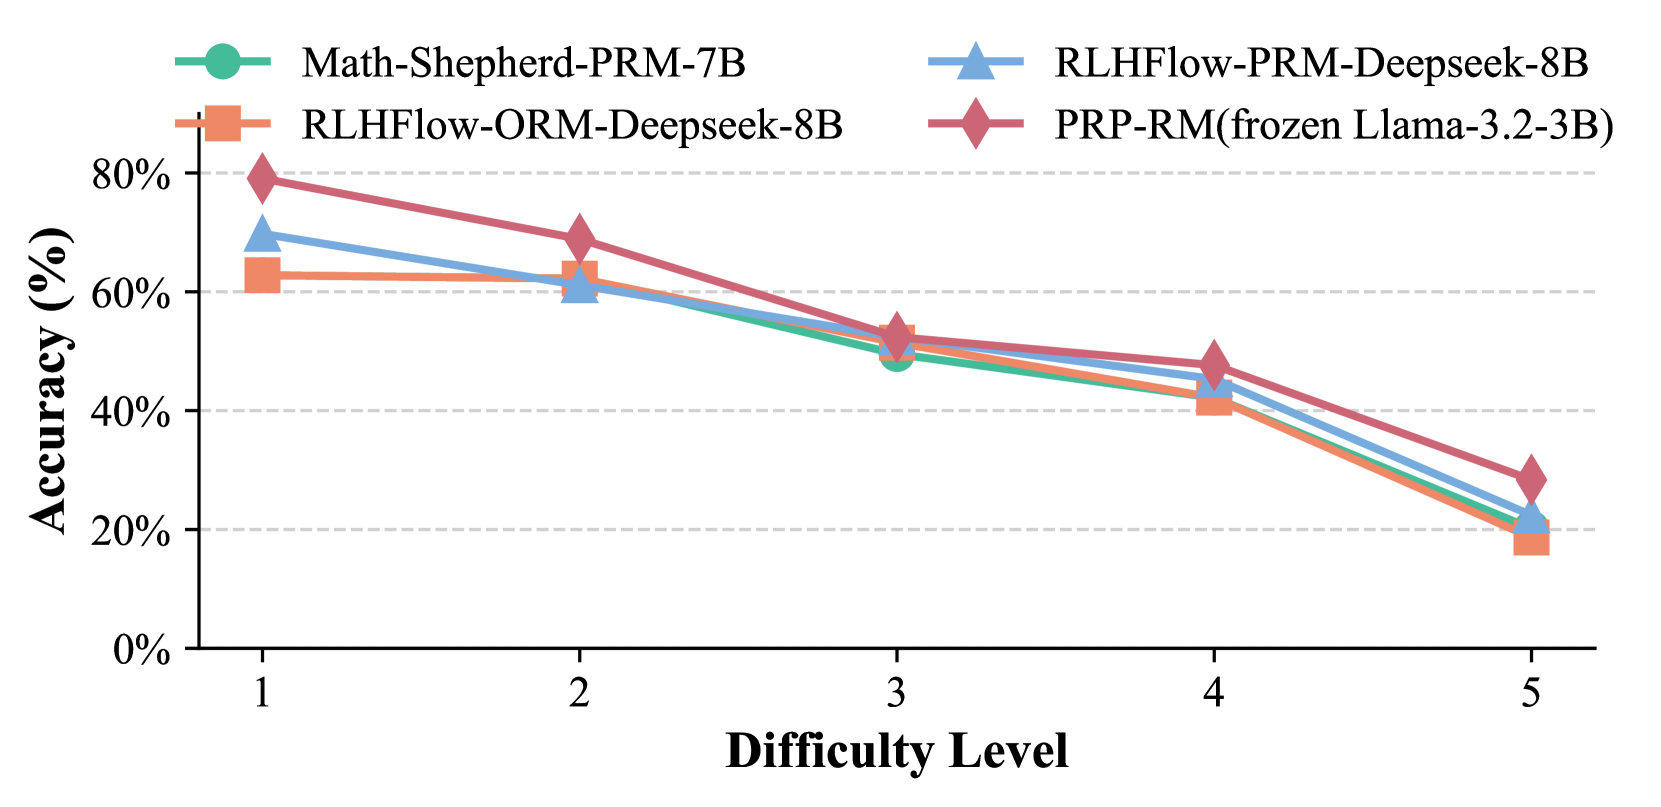
The image is a line graph comparing the accuracy of four different models across five difficulty levels. The x-axis represents "Difficulty Level" (1 to 5), and the y-axis represents "Accuracy (%)" (0% to 80%). Four data series are plotted, each with distinct colors and markers, as indicated in the legend.
### Components/Axes
- **X-axis (Difficulty Level)**: Labeled "Difficulty Level" with ticks at 1, 2, 3, 4, and 5.
- **Y-axis (Accuracy %)**: Labeled "Accuracy (%)" with ticks at 0%, 20%, 40%, 60%, and 80%.
- **Legend**: Located in the top-left corner, with four entries:
- **Math-Shepherd-PRM-7B** (green circle)
- **RLHFlow-PRM-Deepseek-8B** (blue triangle)
- **RLHFlow-ORM-Deepseek-8B** (orange square)
- **PRP-RM(frozen Llama-3.2-3B)** (red diamond)
### Detailed Analysis
- **PRP-RM(frozen Llama-3.2-3B)** (red diamond):
- Difficulty 1: ~80%
- Difficulty 2: ~70%
- Difficulty 3: ~55%
- Difficulty 4: ~45%
- Difficulty 5: ~30%
- **RLHFlow-PRM-Deepseek-8B** (blue triangle):
- Difficulty 1: ~70%
- Difficulty 2: ~60%
- Difficulty 3: ~50%
- Difficulty 4: ~40%
- Difficulty 5: ~25%
- **RLHFlow-ORM-Deepseek-8B** (orange square):
- Difficulty 1: ~65%
- Difficulty 2: ~60%
- Difficulty 3: ~50%
- Difficulty 4: ~40%
- Difficulty 5: ~20%
- **Math-Shepherd-PRM-7B** (green circle):
- Difficulty 1: ~60%
- Difficulty 2: ~60%
- Difficulty 3: ~50%
- Difficulty 4: ~40%
- Difficulty 5: ~20%
### Key Observations
1. **Downward Trend**: All models show a consistent decline in accuracy as difficulty increases.
2. **PRP-RM(frozen Llama-3.2-3B)** maintains the highest accuracy across all difficulty levels, though it drops sharply at higher levels.
3. **RLHFlow-PRM-Deepseek-8B** and **RLHFlow-ORM-Deepseek-8B** exhibit similar trends, with PRM slightly outperforming ORM.
4. **Math-Shepherd-PRM-7B** has the lowest accuracy, with minimal improvement across difficulty levels.
### Interpretation
The data suggests that model performance degrades with increased task complexity. The **PRP-RM(frozen Llama-3.2-3B)** model demonstrates superior robustness, likely due to its frozen architecture or training methodology. In contrast, **Math-Shepherd-PRM-7B** underperforms consistently, indicating potential limitations in its design or training data. The **RLHFlow** models (PRM and ORM) show comparable performance, with PRM marginally better, suggesting that the PRM variant may have more effective alignment or optimization. The steep decline in PRP-RM's accuracy at higher difficulty levels highlights the challenges of generalizing frozen models to complex tasks. This graph underscores the trade-offs between model architecture, training strategies, and task difficulty in achieving high accuracy.