## Log-Log Plot: Validation Loss vs. FLOPs for Varying Model Sizes
### Overview
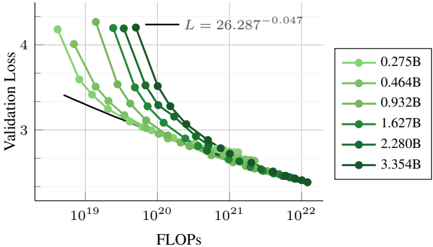
The image is a log-log plot showing the relationship between validation loss and FLOPs (floating point operations per second) for different model sizes. The plot illustrates how validation loss decreases as FLOPs increase, with different lines representing models of varying sizes (0.275B to 3.354B parameters). A power-law fit is also shown on the plot.
### Components/Axes
* **X-axis:** FLOPs (Floating Point Operations Per Second), logarithmic scale from 10^19 to 10^22.
* **Y-axis:** Validation Loss, linear scale from approximately 2.5 to 4.5.
* **Legend:** Located on the right side of the plot, indicating the model size corresponding to each line color. The model sizes are:
* 0.275B (lightest green)
* 0.464B (light green)
* 0.932B (medium green)
* 1.627B (green)
* 2.280B (dark green)
* 3.354B (darkest green)
* **Power-Law Fit:** A black line representing the power-law fit to the data, with the equation L = 26.287 * FLOPs^(-0.047).
### Detailed Analysis
* **0.275B (lightest green):** Starts at approximately (10^19, 4.2) and decreases to approximately (10^22, 2.5).
* **0.464B (light green):** Starts at approximately (10^19, 3.9) and decreases to approximately (10^22, 2.4).
* **0.932B (medium green):** Starts at approximately (10^19, 3.7) and decreases to approximately (10^22, 2.3).
* **1.627B (green):** Starts at approximately (10^19, 3.5) and decreases to approximately (10^22, 2.2).
* **2.280B (dark green):** Starts at approximately (10^19, 3.3) and decreases to approximately (10^22, 2.1).
* **3.354B (darkest green):** Starts at approximately (10^19, 3.2) and decreases to approximately (10^22, 2.0).
All lines show a decreasing trend, indicating that as FLOPs increase, validation loss decreases. The rate of decrease appears to slow down as FLOPs increase, suggesting diminishing returns.
### Key Observations
* **Trend:** All model sizes exhibit a decreasing validation loss as FLOPs increase.
* **Model Size Impact:** Larger models (higher parameter count) generally have lower validation loss for a given number of FLOPs.
* **Power-Law Fit:** The black line represents a power-law fit to the data, suggesting a relationship of the form L = a * FLOPs^b, where 'a' and 'b' are constants. The equation provided is L = 26.287 * FLOPs^(-0.047).
* **Log-Log Scale:** The use of a log-log scale allows for the visualization of a wide range of FLOPs values and highlights the power-law relationship.
### Interpretation
The plot demonstrates the relationship between model size, computational effort (FLOPs), and validation loss. The data suggests that increasing the model size and/or the number of FLOPs used during training leads to a reduction in validation loss, indicating improved model performance. The power-law fit suggests that there is a predictable relationship between FLOPs and validation loss, which can be used to estimate the expected performance of a model given a certain computational budget. The diminishing returns observed at higher FLOPs suggest that there may be a point beyond which increasing FLOPs yields only marginal improvements in validation loss. The different curves for different model sizes indicate that larger models generally achieve lower validation loss for a given number of FLOPs, highlighting the importance of model size in achieving good performance.