## Heatmaps: Layer-wise Transformations Across Three Processing Stages
### Overview
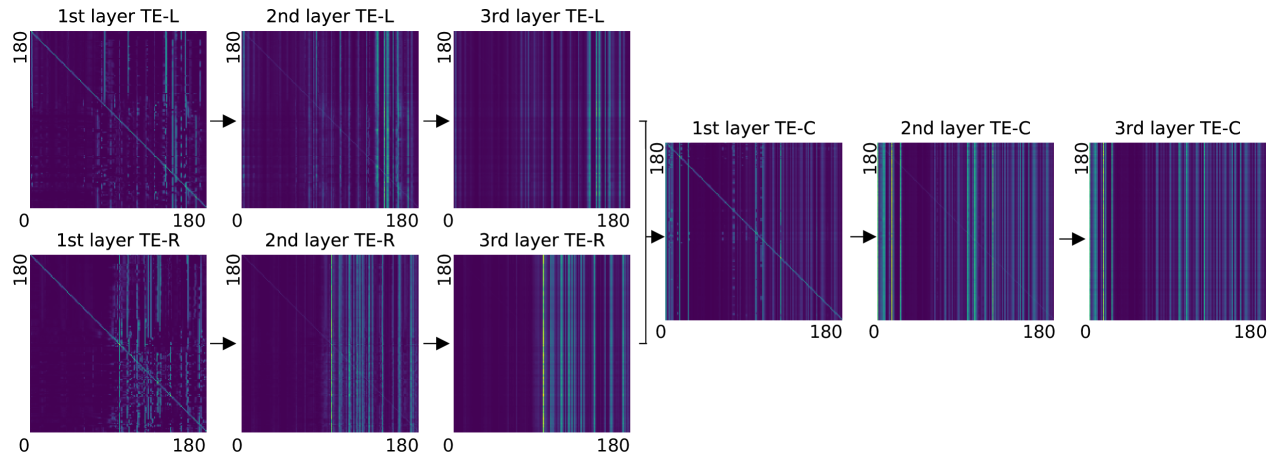
The image displays six heatmaps arranged in a 3x2 grid, representing transformations across three processing layers (1st, 2nd, 3rd) for three modalities: **TE-L** (left), **TE-R** (right), and **TE-C** (central). Each heatmap uses a color gradient from purple (low intensity) to blue (high intensity) to encode values. Arrows between heatmaps indicate sequential progression.
### Components/Axes
- **Axes**:
- X-axis: Labeled `0` to `180` (no explicit title).
- Y-axis: Labeled `0` to `180` (no explicit title).
- **Labels**:
- Top row: `1st layer TE-L`, `2nd layer TE-L`, `3rd layer TE-L`.
- Middle row: `1st layer TE-R`, `2nd layer TE-R`, `3rd layer TE-R`.
- Bottom row: `1st layer TE-C`, `2nd layer TE-C`, `3rd layer TE-C`.
- **Legends**: None visible.
- **Arrows**: Thin gray arrows connect heatmaps horizontally, suggesting sequential processing.
### Detailed Analysis
1. **TE-L Heatmaps (Top Row)**:
- **1st layer**: Diagonal blue streaks dominate the lower-left quadrant, fading into purple elsewhere.
- **2nd layer**: Vertical blue stripes emerge, concentrated in the right half (X=90–180).
- **3rd layer**: Vertical stripes persist but with reduced intensity, showing slight horizontal dispersion.
2. **TE-R Heatmaps (Middle Row)**:
- **1st layer**: Diagonal blue streaks mirror TE-L’s 1st layer but shifted to the upper-right quadrant.
- **2nd layer**: Vertical stripes appear, overlapping with TE-L’s 2nd layer pattern.
- **3rd layer**: Vertical stripes dominate, with faint diagonal remnants in the lower-left.
3. **TE-C Heatmaps (Bottom Row)**:
- **1st layer**: Diagonal blue streaks span the entire diagonal (X=Y).
- **2nd layer**: Vertical stripes dominate, with faint diagonal traces near X=Y.
- **3rd layer**: Uniform vertical stripes, with minimal diagonal interference.
### Key Observations
- **Vertical Stripes**: Appear consistently in TE-L and TE-R heatmaps after the 2nd layer, suggesting stabilization of features.
- **Diagonal Elements**: Dominant in early layers (1st) for TE-L and TE-R, fading in later layers.
- **Color Intensity**: Blue regions (high values) concentrate in specific quadrants early on, becoming more uniform in later layers.
- **Asymmetry**: TE-L and TE-R heatmaps show mirrored patterns in early layers but diverge in later stages.
### Interpretation
The heatmaps likely represent feature maps or attention weights in a neural network or signal processing pipeline. The progression from diagonal to vertical stripes across layers suggests:
1. **Early Layers (1st)**: Capture coarse, spatially varying patterns (diagonals).
2. **Middle Layers (2nd)**: Begin organizing features into structured vertical bands, possibly aligning with hierarchical feature extraction.
3. **Late Layers (3rd)**: Stabilize into uniform vertical distributions, indicating convergence or refinement of features.
The TE-C modality shows the most consistent diagonal-to-vertical transition, implying it may represent a central or aggregated processing pathway. The absence of a legend limits quantitative interpretation of color intensity, but the spatial progression of patterns aligns with typical deep learning layer dynamics.
### Uncertainties
- No explicit axis titles or legends prevent precise quantification of values.
- The meaning of "0–180" axes (e.g., time, spatial coordinates) is unspecified.
- The role of TE-L/TE-R/TE-C modalities (e.g., left/right visual streams, sensor channels) is not clarified.