## Heatmap: Layer Activation Patterns
### Overview
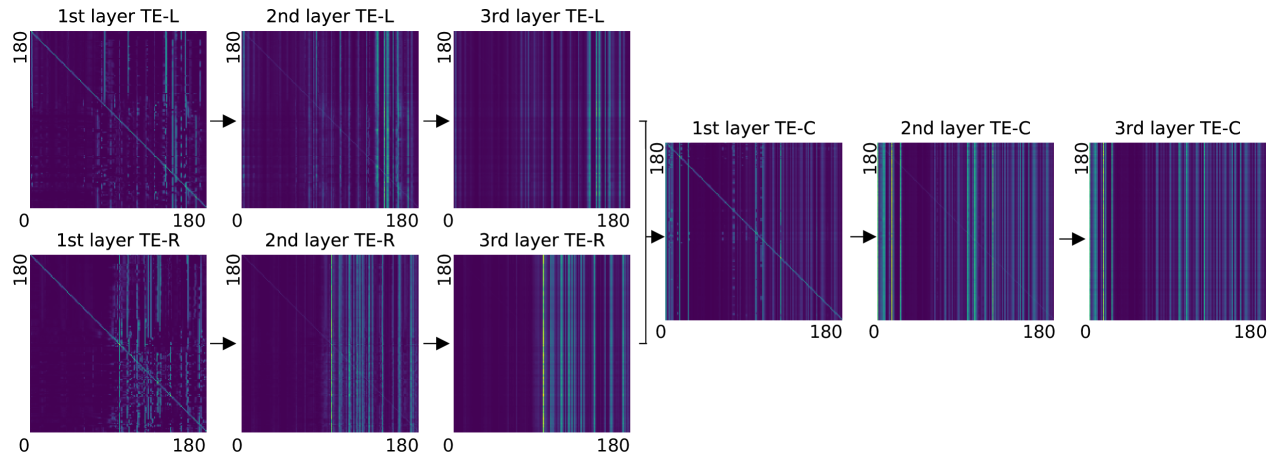
The image displays a series of heatmaps representing activation patterns in different layers of a neural network. The heatmaps are arranged in three groups, labeled TE-L, TE-R, and TE-C, each showing the activation patterns for the 1st, 2nd, and 3rd layers. The heatmaps are square, with axes ranging from 0 to 180. Arrows indicate the progression from one layer to the next within each group.
### Components/Axes
* **X-axis:** Ranges from 0 to 180.
* **Y-axis:** Ranges from 0 to 180.
* **Heatmap Color Scale:** Dark purple indicates low activation, transitioning to light blue/green for higher activation.
* **Titles:**
* 1st layer TE-L
* 2nd layer TE-L
* 3rd layer TE-L
* 1st layer TE-R
* 2nd layer TE-R
* 3rd layer TE-R
* 1st layer TE-C
* 2nd layer TE-C
* 3rd layer TE-C
* **Arrows:** Indicate the progression from the 1st layer to the 2nd, and from the 2nd layer to the 3rd, for each of the TE-L, TE-R, and TE-C groups.
### Detailed Analysis
**TE-L Group:**
* **1st layer TE-L:** Shows a diagonal line of higher activation from the bottom-left to the top-right corner. There are also scattered points and short vertical lines of activation.
* **2nd layer TE-L:** The diagonal line is less prominent. Vertical lines of activation are more pronounced and frequent.
* **3rd layer TE-L:** Vertical lines of activation are even more dominant and distinct.
**TE-R Group:**
* **1st layer TE-R:** Similar to the 1st layer TE-L, with a diagonal line of activation and scattered points.
* **2nd layer TE-R:** Vertical lines of activation become more prominent.
* **3rd layer TE-R:** Vertical lines of activation are the most dominant feature.
**TE-C Group:**
* **1st layer TE-C:** Shows a diagonal line of higher activation from the bottom-left to the top-right corner. There are also scattered points and short vertical lines of activation.
* **2nd layer TE-C:** The diagonal line is less prominent. Vertical lines of activation are more pronounced and frequent.
* **3rd layer TE-C:** Vertical lines of activation are even more dominant and distinct.
### Key Observations
* All three groups (TE-L, TE-R, TE-C) show a similar trend: a shift from a diagonal activation pattern in the first layer to a predominantly vertical line activation pattern in the later layers.
* The intensity of the vertical lines seems to increase from the 1st to the 3rd layer in all groups.
* The diagonal line is most visible in the first layer of each group and diminishes in subsequent layers.
### Interpretation
The heatmaps illustrate how activation patterns evolve through the layers of a neural network under different conditions or configurations (TE-L, TE-R, TE-C). The shift from diagonal to vertical activation patterns suggests that the network is learning to emphasize specific features or relationships as information propagates through the layers. The increasing intensity of the vertical lines indicates that certain neurons or feature detectors are becoming more strongly activated in the deeper layers. The similarity in trends across TE-L, TE-R, and TE-C suggests a common underlying learning process, although the specific details of the activation patterns may differ.