# Roofline Model Analysis (Llama 7B, A100 80GB PCIe)
## Graph Title
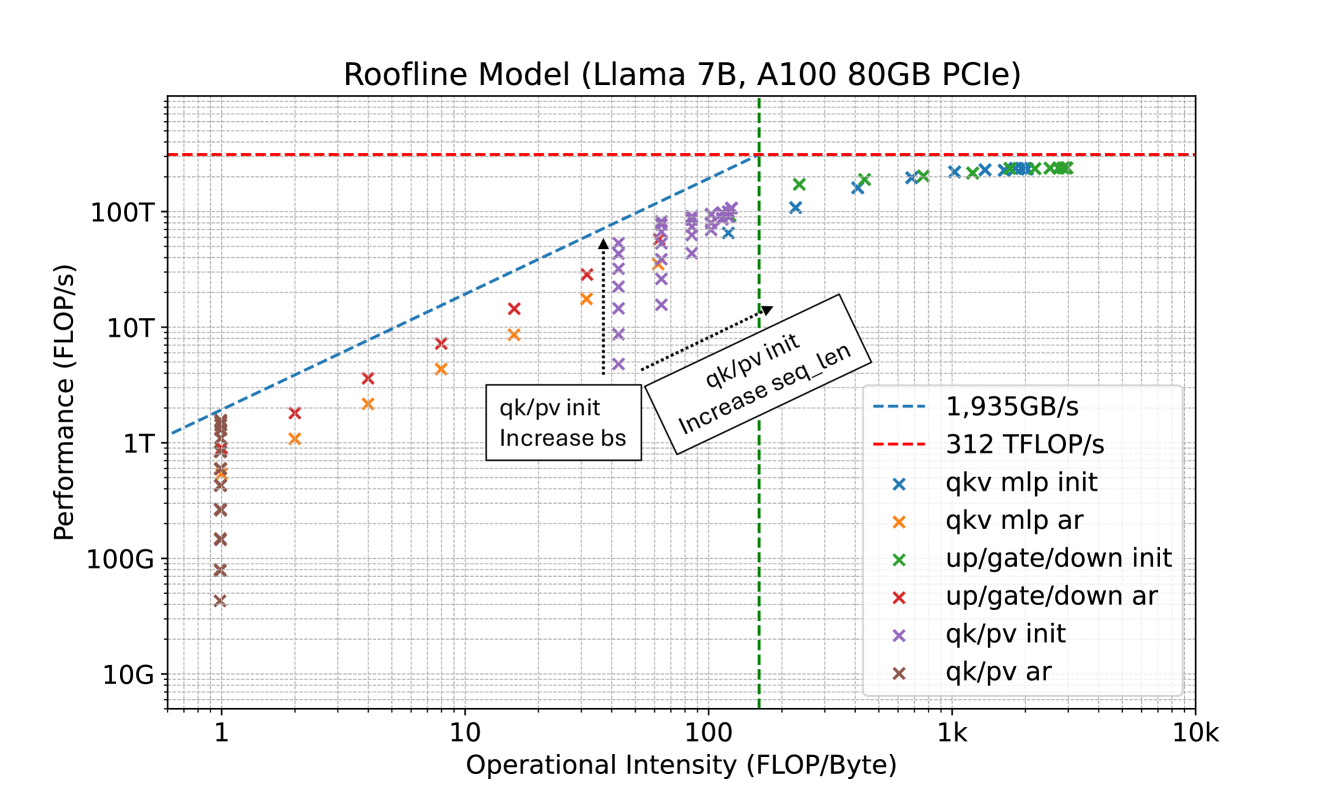
- **Title**: Roofline Model (Llama 7B, A100 80GB PCIe)
## Axes
- **X-axis**: Operational Intensity (FLOP/Byte)
- Range: 1 to 10,000 (logarithmic scale)
- Key markers:
- Vertical green dashed line at **100 FLOP/Byte**
- **Y-axis**: Performance (FLOP/s)
- Range: 10G to 100T (logarithmic scale)
- Key markers:
- Horizontal red dashed line at **312 TFLOP/s**
- Horizontal blue dashed line at **1,935GB/s**
## Legend
| Symbol | Label | Color/Marker |
|--------|------------------------|--------------|
| `x` | qkv mlp init | Blue |
| `x` | qkv mlp ar | Orange |
| `x` | up/gate/down init | Green |
| `x` | up/gate/down ar | Red |
| `x` | qk/pv init | Purple |
| `x` | qk/pv ar | Brown |
## Key Trends
1. **Roofline Boundaries**:
- **Compute Limit**: Red dashed line at **312 TFLOP/s** (theoretical peak performance).
- **Memory Bandwidth Limit**: Blue dashed line at **1,935GB/s** (theoretical memory throughput).
- **Roofline**: Diagonal blue dashed line representing the performance-memory bandwidth tradeoff.
2. **Data Points**:
- Performance improves with increasing operational intensity until reaching the Roofline.
- Beyond **100 FLOP/Byte** (green dashed line), performance plateaus due to memory bandwidth constraints.
3. **Annotations**:
- **qk/pv init Increase bs**: Indicates performance gains from increasing batch size (`bs`).
- **Increase seq_len**: Highlights performance improvements from longer sequence lengths.
## Observations
- **qkv mlp init** (blue `x`) and **qk/pv init** (purple `x`) show steep performance gains at low operational intensity.
- **up/gate/down ar** (red `x`) and **qk/pv ar** (brown `x`) exhibit higher performance at elevated operational intensity.
- All data points cluster below the Roofline, confirming hardware limitations.