## Chart: Gradient Updates vs. Dimension
### Overview
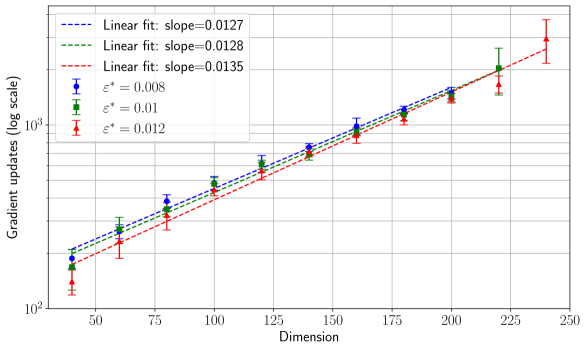
The image is a scatter plot showing the relationship between "Gradient updates (log scale)" and "Dimension" for three different values of epsilon star (ε*). The plot includes error bars for each data point and linear fits for each epsilon star value. The y-axis is on a logarithmic scale.
### Components/Axes
* **X-axis:** Dimension, with tick marks at 50, 75, 100, 125, 150, 175, 200, 225, and 250.
* **Y-axis:** Gradient updates (log scale), with tick marks at 10^2 (100) and 10^3 (1000).
* **Legend (top-left):**
* Blue dashed line: Linear fit: slope=0.0127
* Green dashed line: Linear fit: slope=0.0128
* Red dashed line: Linear fit: slope=0.0135
* Blue circle: ε* = 0.008
* Green square: ε* = 0.01
* Red triangle: ε* = 0.012
### Detailed Analysis
* **ε* = 0.008 (Blue circles):** The data points generally increase as the dimension increases.
* Dimension = 50, Gradient updates ≈ 150
* Dimension = 75, Gradient updates ≈ 250
* Dimension = 100, Gradient updates ≈ 350
* Dimension = 125, Gradient updates ≈ 500
* Dimension = 150, Gradient updates ≈ 600
* Dimension = 175, Gradient updates ≈ 750
* Dimension = 200, Gradient updates ≈ 900
* Dimension = 225, Gradient updates ≈ 1100
* **ε* = 0.01 (Green squares):** The data points generally increase as the dimension increases.
* Dimension = 50, Gradient updates ≈ 175
* Dimension = 75, Gradient updates ≈ 275
* Dimension = 100, Gradient updates ≈ 400
* Dimension = 125, Gradient updates ≈ 525
* Dimension = 150, Gradient updates ≈ 650
* Dimension = 175, Gradient updates ≈ 800
* Dimension = 200, Gradient updates ≈ 950
* Dimension = 225, Gradient updates ≈ 1150
* **ε* = 0.012 (Red triangles):** The data points generally increase as the dimension increases.
* Dimension = 50, Gradient updates ≈ 125
* Dimension = 75, Gradient updates ≈ 225
* Dimension = 100, Gradient updates ≈ 325
* Dimension = 125, Gradient updates ≈ 450
* Dimension = 150, Gradient updates ≈ 575
* Dimension = 175, Gradient updates ≈ 725
* Dimension = 200, Gradient updates ≈ 900
* Dimension = 225, Gradient updates ≈ 1300
### Key Observations
* All three data series show a positive correlation between dimension and gradient updates.
* The linear fits for each epsilon star value have similar slopes, with the red line (ε* = 0.0135) having the steepest slope, followed by the green line (ε* = 0.0128), and then the blue line (ε* = 0.0127).
* The error bars indicate some variability in the gradient updates for each dimension and epsilon star value.
* The gradient updates increase approximately exponentially with dimension, as indicated by the log scale on the y-axis and the linear trend of the data.
### Interpretation
The chart suggests that as the dimension increases, the number of gradient updates required also increases. The different values of epsilon star (ε*) influence the number of gradient updates, with higher values of ε* generally leading to a larger number of gradient updates for a given dimension. The linear fits indicate a consistent rate of increase in gradient updates with dimension for each ε* value. The error bars suggest that there is some inherent variability in the gradient updates, which could be due to factors such as the specific dataset or the optimization algorithm used. The slopes of the linear fits are very close to each other, suggesting that the rate of increase in gradient updates with dimension is similar for all three values of epsilon star.