## Scatter Plot: Gradient Updates vs. Dimension
### Overview
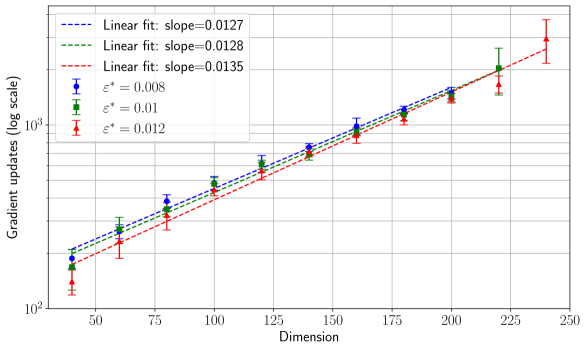
This image presents a scatter plot illustrating the relationship between the dimension of a space and the number of gradient updates required for optimization. Three different experimental setups are compared, each represented by a distinct color and linear fit. Error bars are included for each data point, indicating the variance in gradient update counts. The y-axis is on a logarithmic scale.
### Components/Axes
* **X-axis:** Dimension, ranging from approximately 40 to 240. Labeled "Dimension".
* **Y-axis:** Gradient updates (log scale), ranging from approximately 10^2 to 10^4. Labeled "Gradient updates (log scale)".
* **Data Series 1:** Blue circles with error bars. Legend label: "ε* = 0.008". Linear fit: dashed blue line, slope = 0.0127.
* **Data Series 2:** Green circles with error bars. Legend label: "ε* = 0.01". Linear fit: solid green line, slope = 0.0128.
* **Data Series 3:** Red circles with error bars. Legend label: "ε* = 0.012". Linear fit: dashed-dotted red line, slope = 0.0135.
* **Legend:** Located in the top-left corner of the plot. It maps colors to the values of ε*.
### Detailed Analysis
The plot shows a clear positive correlation between dimension and gradient updates for all three experimental setups. The relationship appears approximately linear, as indicated by the fitted lines.
**Data Series 1 (ε* = 0.008 - Blue):**
* At Dimension = 50, Gradient Updates ≈ 250 (approximately 10^2.4). Error bar extends from approximately 200 to 300.
* At Dimension = 100, Gradient Updates ≈ 750 (approximately 10^2.9). Error bar extends from approximately 600 to 900.
* At Dimension = 150, Gradient Updates ≈ 1700 (approximately 10^3.2). Error bar extends from approximately 1400 to 2000.
* At Dimension = 200, Gradient Updates ≈ 3300 (approximately 10^3.5). Error bar extends from approximately 2800 to 3800.
* At Dimension = 225, Gradient Updates ≈ 4500 (approximately 10^3.65). Error bar extends from approximately 3800 to 5200.
**Data Series 2 (ε* = 0.01 - Green):**
* At Dimension = 50, Gradient Updates ≈ 300 (approximately 10^2.5). Error bar extends from approximately 250 to 350.
* At Dimension = 100, Gradient Updates ≈ 800 (approximately 10^2.9). Error bar extends from approximately 650 to 950.
* At Dimension = 150, Gradient Updates ≈ 1800 (approximately 10^3.3). Error bar extends from approximately 1500 to 2100.
* At Dimension = 200, Gradient Updates ≈ 3500 (approximately 10^3.5). Error bar extends from approximately 3000 to 4000.
* At Dimension = 225, Gradient Updates ≈ 4800 (approximately 10^3.68). Error bar extends from approximately 4000 to 5600.
**Data Series 3 (ε* = 0.012 - Red):**
* At Dimension = 50, Gradient Updates ≈ 350 (approximately 10^2.5). Error bar extends from approximately 300 to 400.
* At Dimension = 100, Gradient Updates ≈ 900 (approximately 10^2.95). Error bar extends from approximately 750 to 1050.
* At Dimension = 150, Gradient Updates ≈ 2000 (approximately 10^3.3). Error bar extends from approximately 1700 to 2300.
* At Dimension = 200, Gradient Updates ≈ 3800 (approximately 10^3.6). Error bar extends from approximately 3300 to 4300.
* At Dimension = 225, Gradient Updates ≈ 5200 (approximately 10^3.7). Error bar extends from approximately 4500 to 5900.
### Key Observations
* The number of gradient updates increases linearly with dimension for all three values of ε*.
* Higher values of ε* (0.012) consistently require more gradient updates than lower values (0.008 and 0.01).
* The error bars indicate some variability in the gradient update counts, but the overall trend remains consistent.
* The slopes of the linear fits are relatively similar, ranging from 0.0127 to 0.0135.
### Interpretation
The data suggests that the complexity of the optimization problem increases linearly with the dimensionality of the space. This is reflected in the increasing number of gradient updates required to reach a solution as the dimension grows. The parameter ε* likely represents a step size or learning rate, and larger values of ε* appear to necessitate more updates, potentially due to overshooting or instability in the optimization process. The consistent linear trend across different ε* values indicates a fundamental relationship between dimensionality and optimization effort. The error bars suggest that the exact number of updates can vary, but the underlying linear relationship holds. This could be due to the stochastic nature of gradient descent or variations in the initial conditions of the optimization. The plot provides valuable insight into the scalability of the optimization algorithm and the impact of parameter settings on its performance.