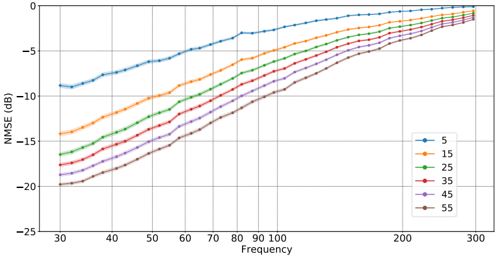
## Line Chart: NMSE vs Frequency
### Overview
The image is a line chart depicting the relationship between Normalized Mean Squared Error (NMSE) in decibels (dB) and frequency in Hertz (Hz). Six distinct data series are plotted, each corresponding to a specific value (5, 15, 25, 35, 45, 55), with lines colored uniquely for differentiation. All lines exhibit a consistent upward trend as frequency increases, indicating a positive correlation between NMSE and frequency.
### Components/Axes
- **Y-Axis (Left)**: Labeled "NMSE (dB)" with a scale ranging from 0 to -25 dB in 5 dB increments.
- **X-Axis (Bottom)**: Labeled "Frequency" with a scale from 30 Hz to 300 Hz in 10 Hz increments.
- **Legend**: Positioned on the right side of the chart, mapping colors to values:
- Blue: 5
- Orange: 15
- Green: 25
- Red: 35
- Purple: 45
- Brown: 55
- **Lines**: Six colored lines (blue, orange, green, red, purple, brown) represent the six data series. Each line starts at a lower NMSE value at 30 Hz and increases (becomes less negative) as frequency rises to 300 Hz.
### Detailed Analysis
- **Line Trends**:
- **Blue (5)**: Starts at ~-10 dB at 30 Hz, ends near 0 dB at 300 Hz. Slope is the least steep.
- **Orange (15)**: Starts at ~-15 dB at 30 Hz, ends near -5 dB at 300 Hz. Slope is steeper than blue.
- **Green (25)**: Starts at ~-18 dB at 30 Hz, ends near -8 dB at 300 Hz. Slope is steeper than orange.
- **Red (35)**: Starts at ~-20 dB at 30 Hz, ends near -10 dB at 300 Hz. Slope is steeper than green.
- **Purple (45)**: Starts at ~-22 dB at 30 Hz, ends near -12 dB at 300 Hz. Slope is steeper than red.
- **Brown (55)**: Starts at ~-24 dB at 30 Hz, ends near -14 dB at 300 Hz. Slope is the steepest.
- **Spacing**: Lines are evenly spaced vertically at 30 Hz, with gaps decreasing slightly as frequency increases. At 300 Hz, the lines converge closer but remain distinct.
### Key Observations
1. **Positive Correlation**: All lines show a consistent upward trend, confirming that NMSE increases with frequency.
2. **Value-Specific Behavior**: Higher values (e.g., 55) start with lower NMSE at 30 Hz but exhibit steeper slopes, closing the gap with lower values (e.g., 5) at higher frequencies.
3. **Parallelism**: Lines maintain parallel trajectories, suggesting a linear relationship between frequency and NMSE for each value.
4. **Convergence**: At 300 Hz, the lines are closer together, indicating diminishing differences in NMSE across values at high frequencies.
### Interpretation
The data suggests that NMSE is inversely related to frequency across all values, with higher values (e.g., 55) demonstrating greater sensitivity to frequency changes. The parallel lines imply a uniform scaling of NMSE with frequency, independent of the value. This could indicate a systematic relationship between measurement accuracy (NMSE) and frequency in a technical system, where higher frequencies inherently introduce more error. The convergence at 300 Hz may reflect a saturation effect or a limit to the system's frequency-dependent performance degradation. The legend's color coding ensures clear differentiation of values, critical for analyzing value-specific trends.