## Chart: Predictive Probability with Uniform Prior
### Overview
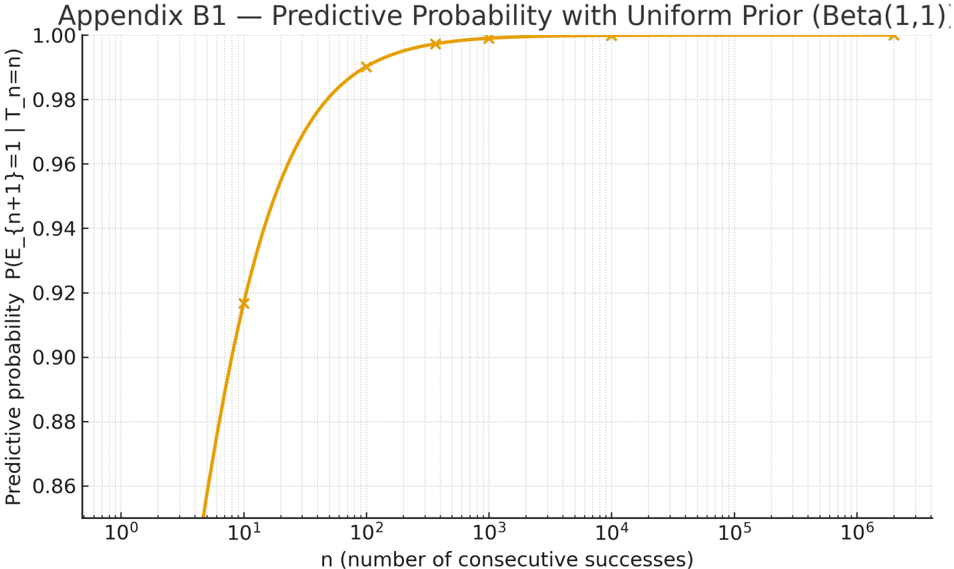
The image is a line chart that illustrates the predictive probability of an event (E_{n+1}=1) given a number of consecutive successes (T_n=n), using a uniform prior (Beta(1,1)). The x-axis represents the number of consecutive successes on a logarithmic scale, and the y-axis represents the predictive probability. The chart shows how the predictive probability increases with the number of consecutive successes, approaching 1.00.
### Components/Axes
* **Title:** Appendix B1 – Predictive Probability with Uniform Prior (Beta(1,1))
* **X-axis:**
* Label: n (number of consecutive successes)
* Scale: Logarithmic (base 10)
* Markers: 10<sup>0</sup>, 10<sup>1</sup>, 10<sup>2</sup>, 10<sup>3</sup>, 10<sup>4</sup>, 10<sup>5</sup>, 10<sup>6</sup>
* **Y-axis:**
* Label: Predictive probability P(E_{n+1}=1 | T\_n=n)
* Scale: Linear
* Markers: 0.86, 0.88, 0.90, 0.92, 0.94, 0.96, 0.98, 1.00
* **Data Series:**
* Color: Golden Yellow
* Description: Predictive probability as a function of consecutive successes.
### Detailed Analysis
The golden yellow line represents the predictive probability. The line starts at approximately 0.85 at n=10<sup>0</sup> and increases rapidly until approximately n=10<sup>2</sup>. After n=10<sup>2</sup>, the rate of increase slows down significantly, and the line approaches 1.00 asymptotically.
Here are some approximate data points:
* At n = 10<sup>0</sup> (1), the predictive probability is approximately 0.85.
* At n = 10<sup>1</sup> (10), the predictive probability is approximately 0.915.
* At n = 10<sup>2</sup> (100), the predictive probability is approximately 0.97.
* At n = 10<sup>3</sup> (1000), the predictive probability is approximately 0.99.
* At n = 10<sup>4</sup> (10000), the predictive probability is approximately 0.997.
* At n = 10<sup>5</sup> (100000), the predictive probability is approximately 0.999.
* At n = 10<sup>6</sup> (1000000), the predictive probability is approximately 0.9995.
### Key Observations
* The predictive probability increases with the number of consecutive successes.
* The rate of increase diminishes as the number of consecutive successes increases.
* The predictive probability approaches 1.00 asymptotically.
### Interpretation
The chart demonstrates how the predictive probability of an event, given a uniform prior, is influenced by the number of consecutive successes. As the number of consecutive successes increases, the predictive probability of the event occurring again approaches certainty (1.00). This aligns with Bayesian reasoning, where prior beliefs are updated with observed data. The uniform prior (Beta(1,1)) implies that initially, all outcomes are equally likely. However, as more successes are observed, the belief in the event's likelihood increases, leading to a higher predictive probability. The asymptotic behavior suggests that after a certain number of successes, additional successes have a diminishing impact on the predictive probability.