\n
## Chart: Predictive Probability with Uniform Prior
### Overview
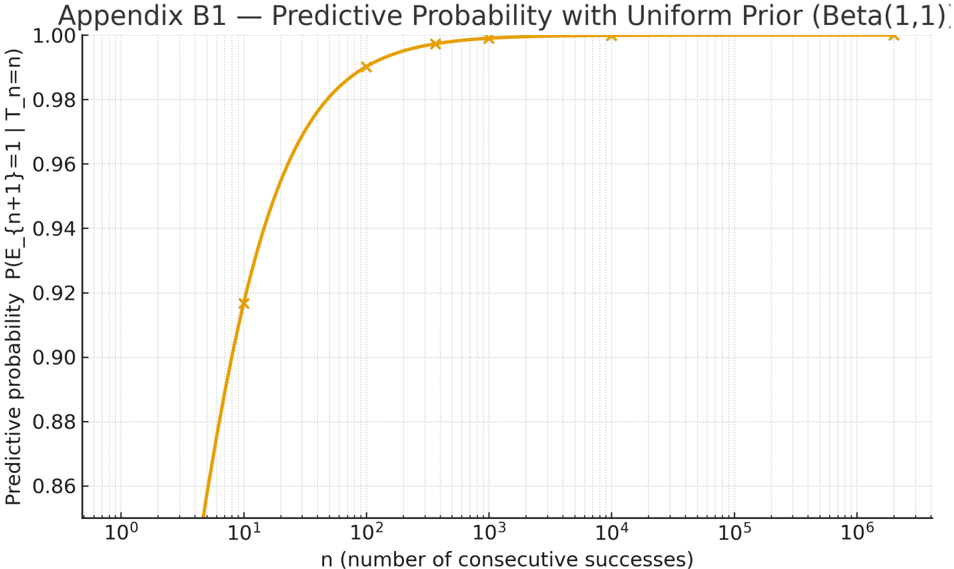
The image displays a line chart illustrating the predictive probability of success given a number of consecutive successes, assuming a uniform prior distribution (Beta(1,1)). The chart shows how the probability of the next event being a success increases as the number of consecutive successes increases.
### Components/Axes
* **Title:** "Appendix B1 – Predictive Probability with Uniform Prior (Beta(1,1))" - positioned at the top-center of the image.
* **X-axis Label:** "n (number of consecutive successes)" - positioned at the bottom-center of the image. The scale is logarithmic, with markers at 10⁰, 10¹, 10², 10³, 10⁴, 10⁵, and 10⁶.
* **Y-axis Label:** "Predictive probability P(E_{n+1}=1 | n=n)" - positioned at the left-center of the image. The scale ranges from approximately 0.86 to 1.00, with markers at 0.86, 0.88, 0.90, 0.92, 0.94, 0.96, 0.98, and 1.00.
* **Data Series:** A single orange line representing the predictive probability.
* **Grid:** A light-yellow grid is present, aiding in reading values from the chart.
### Detailed Analysis
The orange line starts at approximately 0.88 when n = 10⁰ (n=1). It then rises sharply, approaching 0.92 at n = 10¹ (n=10). The curve continues to increase, but at a decreasing rate, reaching approximately 0.98 at n = 10² (n=100). The line plateaus, approaching 0.995 at n = 10³ (n=1000), and continues to asymptotically approach 1.00 as n increases towards 10⁶ (n=1,000,000).
Approximate data points:
* n = 1 (10⁰): P ≈ 0.88
* n = 10 (10¹): P ≈ 0.92
* n = 100 (10²): P ≈ 0.98
* n = 1000 (10³): P ≈ 0.995
* n = 10000 (10⁴): P ≈ 0.998
* n = 100000 (10⁵): P ≈ 0.999
* n = 1000000 (10⁶): P ≈ 0.9995
The line exhibits a steep initial increase, followed by diminishing returns as the number of consecutive successes grows.
### Key Observations
The chart demonstrates a strong positive correlation between the number of consecutive successes and the predictive probability of the next event being a success. The initial successes have a disproportionately large impact on increasing the probability, while subsequent successes contribute less and less to the overall probability. The curve approaches 1.0 asymptotically, indicating that even with a large number of consecutive successes, there is always a non-zero probability of failure.
### Interpretation
This chart illustrates the Bayesian updating of belief. The uniform prior (Beta(1,1)) represents initial uncertainty about the probability of success. As we observe consecutive successes (increasing 'n'), our belief in the probability of success increases. The shape of the curve reflects the nature of the Beta distribution and how it updates with observed data. The logarithmic scale on the x-axis highlights the diminishing returns of additional successes. The chart is a visual representation of how evidence accumulates to refine our predictions. The fact that the probability never reaches 1.0 even with a large number of successes reflects the inherent uncertainty in probabilistic models. This is a fundamental concept in Bayesian statistics and is applicable to various fields, such as machine learning, A/B testing, and risk assessment.