## Line Graph: Predictive Probability with Uniform Prior (Beta(1,1))
### Overview
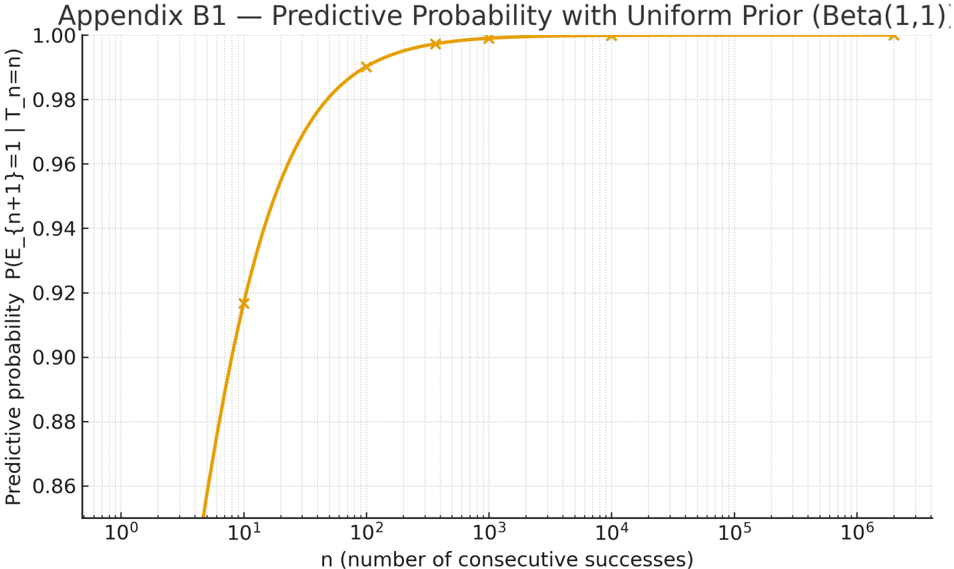
The graph illustrates how predictive probability evolves with increasing numbers of consecutive successes under a uniform prior (Beta(1,1)). The x-axis uses a logarithmic scale to represent the number of consecutive successes (`n`), while the y-axis shows predictive probability values between 0.86 and 1.00. A smooth orange curve with x-marked data points demonstrates the trend.
### Components/Axes
- **Title**: "Appendix B1 — Predictive Probability with Uniform Prior (Beta(1,1))"
- **X-axis**:
- Label: "n (number of consecutive successes)"
- Scale: Logarithmic (10⁰ to 10⁶)
- Ticks: 10⁰, 10¹, 10², 10³, 10⁴, 10⁵, 10⁶
- **Y-axis**:
- Label: "Predictive probability"
- Range: 0.86 to 1.00 (linear scale)
- **Legend**: Not explicitly labeled, but the orange line with x-markers represents the predictive probability curve.
- **Grid**: Dotted gridlines for reference.
### Detailed Analysis
- **Data Points**:
- At `n = 10⁰` (1 success): Predictive probability ≈ 0.86
- At `n = 10¹` (10 successes): Predictive probability ≈ 0.92
- At `n = 10²` (100 successes): Predictive probability ≈ 0.98
- At `n = 10³` (1,000 successes): Predictive probability ≈ 0.99
- At `n = 10⁴` (10,000 successes): Predictive probability ≈ 0.999
- At `n = 10⁵` (100,000 successes): Predictive probability ≈ 0.9999
- At `n = 10⁶` (1,000,000 successes): Predictive probability ≈ 0.99999
- **Trend**: The curve starts at 0.86 for `n = 1`, rises steeply to 0.98 by `n = 100`, and asymptotically approaches 1.00 as `n` increases. The logarithmic x-axis emphasizes the rapid initial growth and eventual plateau.
### Key Observations
1. **Rapid Initial Growth**: Predictive probability increases sharply from 0.86 to 0.98 as `n` grows from 1 to 100.
2. **Asymptotic Behavior**: Beyond `n = 100`, the probability approaches 1.00 but never reaches it, reflecting Bayesian uncertainty even with large `n`.
3. **Logarithmic Scale Impact**: The x-axis compression highlights the diminishing returns of additional successes at higher `n` values.
### Interpretation
The graph demonstrates Bayesian updating with a uniform prior (Beta(1,1)). Each success incrementally shifts the posterior distribution toward higher success probabilities, but the uniform prior ensures no initial bias. The curve’s shape reveals:
- **Early Data Dominance**: Small `n` values (e.g., 1–100) drive significant probability shifts, emphasizing the impact of initial observations.
- **Diminishing Returns**: At large `n` (e.g., 10⁵–10⁶), additional successes yield negligible probability increases, illustrating the law of diminishing returns in Bayesian inference.
- **Uniform Prior Role**: The Beta(1,1) prior acts as a "blank slate," allowing data to dominate predictions. This contrasts with informative priors that might skew results differently.
The visualization underscores how Bayesian methods balance prior assumptions with empirical evidence, particularly in scenarios with sparse or abundant data.