## Bar Chart: Categorical Count Distribution
### Overview
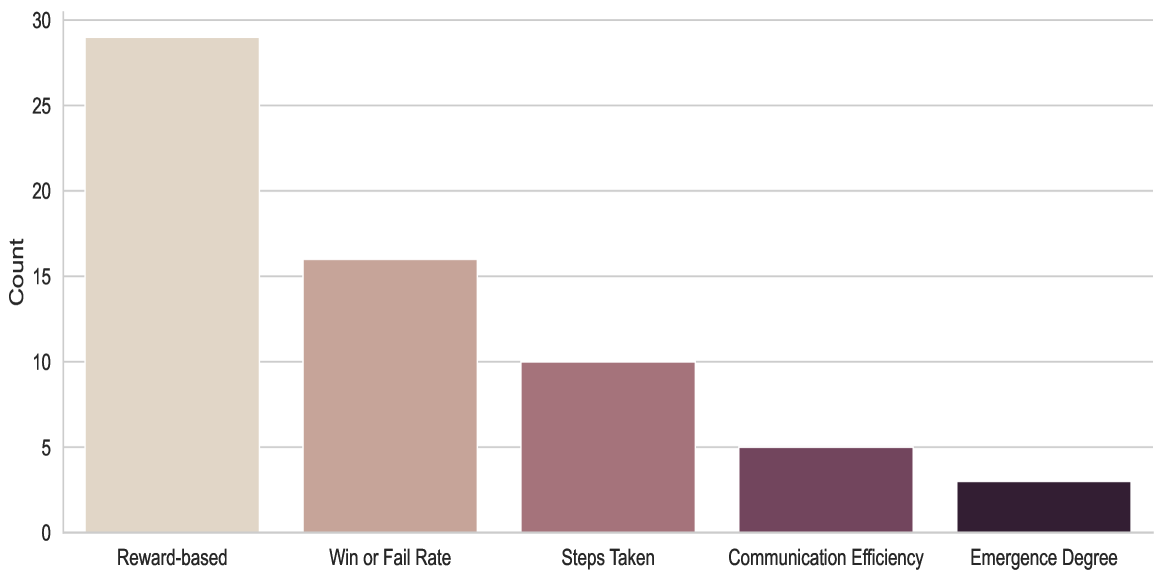
The image displays a vertical bar chart comparing five categorical metrics across a count scale. The chart uses a gradient color scheme transitioning from light beige to dark purple, with bars decreasing in height from left to right. No explicit title is visible, but axis labels and data points are clearly defined.
### Components/Axes
- **X-Axis (Categories)**:
- Reward-based
- Win or Fail Rate
- Steps Taken
- Communication Efficiency
- Emergence Degree
- **Y-Axis (Count)**:
- Scale ranges from 0 to 30 in increments of 5.
- Label: "Count"
- **Legend**:
- Not explicitly present. Color gradient (light beige → dark purple) correlates with bar height and category order.
### Detailed Analysis
1. **Reward-based**:
- Tallest bar, reaching approximately **29** on the y-axis.
- Color: Light beige (#F5F5DC).
2. **Win or Fail Rate**:
- Second tallest, approximately **16**.
- Color: Tan (#D2B48C).
3. **Steps Taken**:
- Approximately **10**.
- Color: Medium brown (#8B4513).
4. **Communication Efficiency**:
- Approximately **5**.
- Color: Dark purple (#800080).
5. **Emergence Degree**:
- Shortest bar, approximately **3**.
- Color: Very dark purple (#000080).
### Key Observations
- **Descending Order**: Categories are ordered left-to-right by decreasing count, with no apparent categorical logic (e.g., alphabetical or functional grouping).
- **Significant Drop-Off**: The count decreases sharply from Reward-based (29) to Win or Fail Rate (16), then gradually declines to Emergence Degree (3).
- **Color Gradient**: Bar colors transition from light to dark, potentially indicating a visual hierarchy or implicit ranking.
### Interpretation
The data suggests a hierarchical prioritization or frequency distribution among the measured metrics. Reward-based dominates as the most significant factor (29 counts), while Emergence Degree is the least prominent (3 counts). The absence of a legend leaves the color gradient’s purpose ambiguous—it may represent either a deliberate visual encoding of rank or a stylistic choice. The lack of a title or contextual labels limits interpretation of the metrics’ real-world significance. The sharp decline between Reward-based and Win or Fail Rate implies a potential outlier or dominant factor in the dataset.