## Line Chart: ECE vs Corruption Severity - ImageNet
### Overview
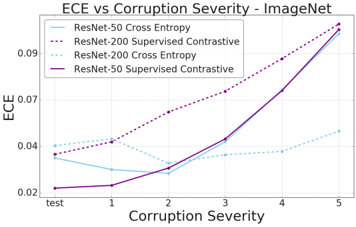
The chart compares the Expected Calibration Error (ECE) of different ResNet models under varying corruption severity levels (0-5) on the ImageNet dataset. Four data series are plotted, representing combinations of ResNet architectures (50/200 layers) and training objectives (Cross Entropy vs Supervised Contrastive).
### Components/Axes
- **X-axis**: Corruption Severity (0 = "test", 1-5 = increasing severity)
- **Y-axis**: ECE (0.02-0.09 range)
- **Legend**:
- Solid blue: ResNet-50 Cross Entropy
- Dashed purple: ResNet-200 Supervised Contrastive
- Dotted light blue: ResNet-200 Cross Entropy
- Solid purple: ResNet-50 Supervised Contrastive
- **Placement**: Legend in top-left corner; axes labeled with standard Cartesian coordinates
### Detailed Analysis
1. **ResNet-50 Cross Entropy** (solid blue):
- Starts at ~0.035 at "test"
- Drops to ~0.03 at severity 1
- Rises to ~0.045 at severity 5
- Shows U-shaped curve with minimum at severity 1
2. **ResNet-200 Supervised Contrastive** (dashed purple):
- Starts at ~0.035 at "test"
- Increases steadily to ~0.085 at severity 5
- Linear upward trend with slope ~0.01 per severity unit
3. **ResNet-200 Cross Entropy** (dotted light blue):
- Starts at ~0.04 at "test"
- Dips to ~0.03 at severity 2
- Rises to ~0.045 at severity 5
- Shallow U-shaped curve with minimum at severity 2
4. **ResNet-50 Supervised Contrastive** (solid purple):
- Starts at ~0.02 at "test"
- Sharp linear increase to ~0.09 at severity 5
- Steepest slope (~0.014 per severity unit)
### Key Observations
- All models show increased ECE with higher corruption severity
- Supervised Contrastive training generally exhibits higher ECE than Cross Entropy
- ResNet-50 Supervised Contrastive demonstrates the most severe degradation (highest ECE at severity 5)
- ResNet-200 Cross Entropy shows unexpected resilience at severity 2
- "Test" condition (severity 0) serves as baseline for all models
### Interpretation
The data suggests that supervised contrastive training methods (both ResNet-50 and 200) are more sensitive to corruption severity than cross entropy training. The ResNet-50 Supervised Contrastive model shows the most dramatic degradation, with ECE increasing 300% from test to maximum severity. This indicates potential overfitting to clean data or poor generalization to corrupted inputs. The ResNet-200 architecture appears more robust overall, maintaining lower ECE across most severity levels despite using supervised contrastive training. The U-shaped patterns in Cross Entropy models suggest possible calibration improvements at moderate corruption levels. These findings highlight the importance of corruption-aware training strategies and model architecture selection for robust image classification systems.