## Line Graph: Latency vs. Prompt Length
### Overview
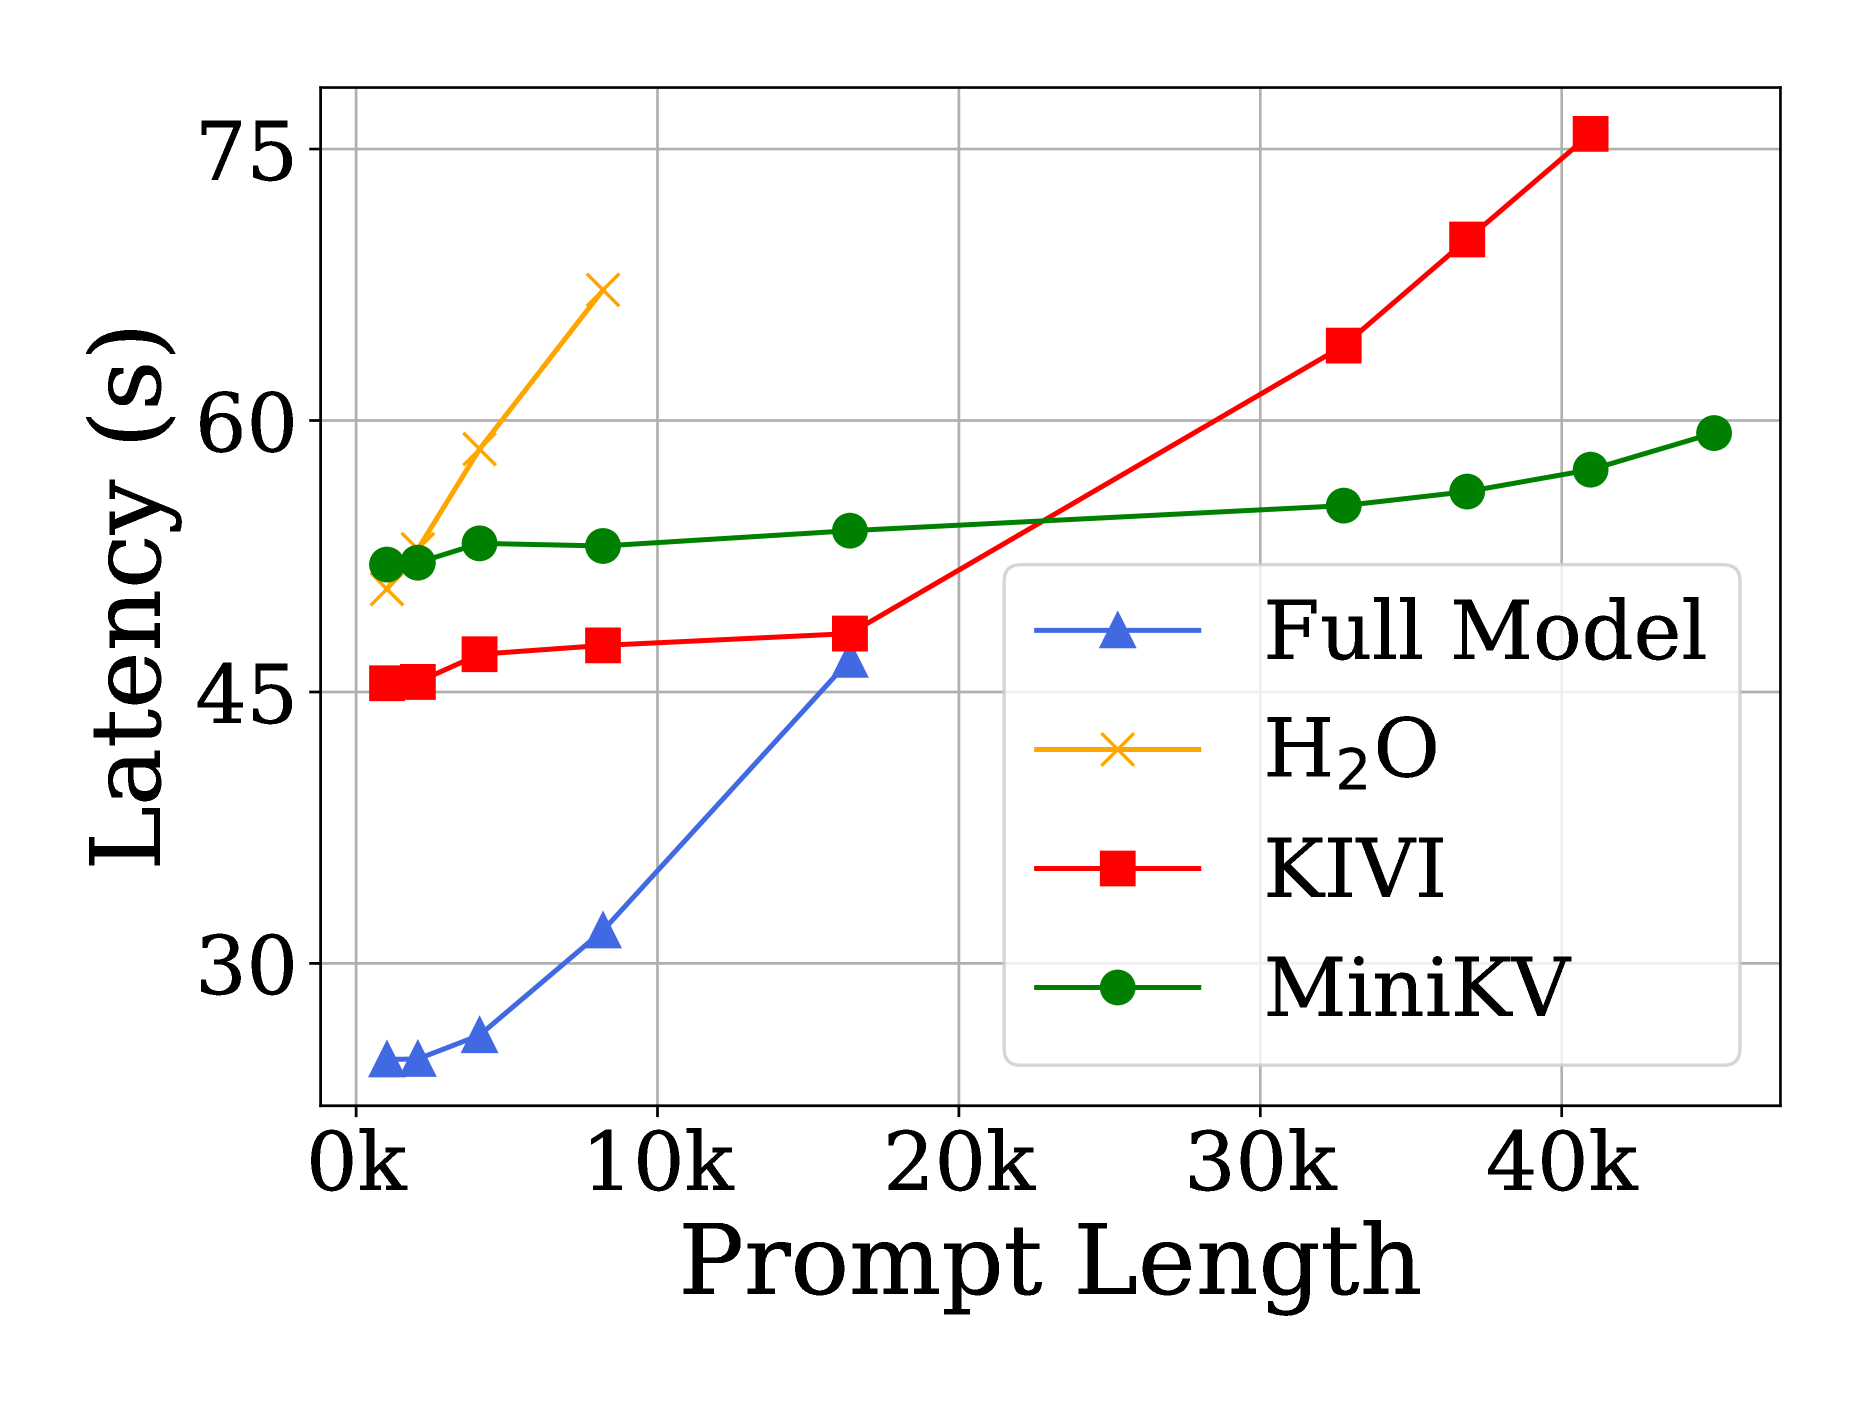
The image is a line graph comparing latency (in seconds) across four different models (Full Model, H2O, KIVI, MiniKV) as prompt length increases from 0k to 40k. The y-axis represents latency (0–75 seconds), and the x-axis represents prompt length (0k–40k). Each model is represented by a distinct line with unique markers and colors.
### Components/Axes
- **X-axis (Prompt Length)**: Labeled "Prompt Length" with ticks at 0k, 10k, 20k, 30k, and 40k.
- **Y-axis (Latency)**: Labeled "Latency (s)" with ticks at 0, 15, 30, 45, 60, and 75 seconds.
- **Legend**: Located in the bottom-right corner, mapping:
- Blue triangles: Full Model
- Orange crosses: H2O
- Red squares: KIVI
- Green circles: MiniKV
### Detailed Analysis
1. **Full Model (Blue Triangles)**:
- Starts at ~25 seconds for 0k prompt length.
- Increases sharply to ~60 seconds at 40k.
- Key data points: 0k (~25s), 10k (~30s), 20k (~45s), 30k (~55s), 40k (~60s).
2. **H2O (Orange Crosses)**:
- Starts at ~50 seconds for 0k.
- Decreases sharply to ~45 seconds at 10k.
- Remains relatively flat at ~45 seconds for 20k–40k.
- Key data points: 0k (~50s), 10k (~45s), 20k (~45s), 30k (~45s), 40k (~45s).
3. **KIVI (Red Squares)**:
- Starts at ~45 seconds for 0k.
- Increases steadily to ~75 seconds at 40k.
- Key data points: 0k (~45s), 10k (~47s), 20k (~50s), 30k (~60s), 40k (~75s).
4. **MiniKV (Green Circles)**:
- Starts at ~50 seconds for 0k.
- Remains relatively flat, increasing slightly to ~60 seconds at 40k.
- Key data points: 0k (~50s), 10k (~52s), 20k (~54s), 30k (~56s), 40k (~60s).
### Key Observations
- **H2O** shows the most significant drop in latency (from ~50s to ~45s) as prompt length increases, suggesting efficiency at higher loads.
- **KIVI** exhibits the steepest upward trend, indicating poor scalability with longer prompts.
- **MiniKV** maintains the most stable latency, with only a modest increase (~10s) across all prompt lengths.
- **Full Model** balances moderate latency growth (~35s increase) but starts lower than H2O and MiniKV.
### Interpretation
The graph highlights trade-offs between model efficiency and scalability. **H2O** performs best at shorter prompt lengths but plateaus, while **KIVI** struggles with longer prompts. **MiniKV** demonstrates consistent performance, making it suitable for variable workloads. **Full Model** offers a middle ground, with manageable latency growth but higher initial latency than H2O and MiniKV. The data suggests that model choice depends on the expected prompt length and latency tolerance.