## Line Chart: Cost per Sequence vs. Number of Items per Sequence for Different Neural Network Architectures
### Overview
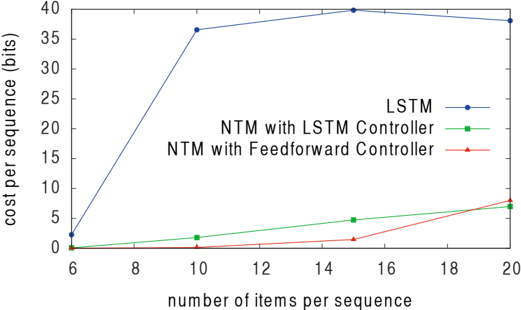
The image is a line chart comparing the computational cost (measured in bits) of three different neural network architectures as the length of the input sequence increases. The chart demonstrates how the cost scales with sequence length for a standard LSTM and two variants of a Neural Turing Machine (NTM).
### Components/Axes
* **Chart Type:** Line chart with markers.
* **X-Axis (Horizontal):**
* **Label:** `number of items per sequence`
* **Scale:** Linear, ranging from 6 to 20.
* **Major Tick Marks:** 6, 8, 10, 12, 14, 16, 18, 20.
* **Y-Axis (Vertical):**
* **Label:** `cost per sequence (bits)`
* **Scale:** Linear, ranging from 0 to 40.
* **Major Tick Marks:** 0, 5, 10, 15, 20, 25, 30, 35, 40.
* **Legend:** Positioned in the center-right area of the plot.
* **Blue line with circle markers:** `LSTM`
* **Green line with square markers:** `NTM with LSTM Controller`
* **Red line with triangle markers:** `NTM with Feedforward Controller`
### Detailed Analysis
The chart plots three distinct data series. Below is an analysis of each, including approximate data points extracted from the visual markers.
**1. LSTM (Blue line, circle markers)**
* **Trend:** Shows a very steep, near-linear increase in cost for shorter sequences, which then plateaus and slightly decreases for longer sequences.
* **Data Points (Approximate):**
* At 6 items: ~2 bits
* At 10 items: ~36 bits
* At 15 items: ~40 bits (peak)
* At 20 items: ~38 bits
**2. NTM with LSTM Controller (Green line, square markers)**
* **Trend:** Exhibits a steady, gradual, and approximately linear increase in cost across the entire range of sequence lengths.
* **Data Points (Approximate):**
* At 6 items: ~0 bits
* At 10 items: ~2 bits
* At 15 items: ~4 bits
* At 20 items: ~6 bits
**3. NTM with Feedforward Controller (Red line, triangle markers)**
* **Trend:** Remains very low and nearly flat for shorter sequences, then shows a sharp, accelerating increase in cost for sequences longer than 15 items.
* **Data Points (Approximate):**
* At 6 items: ~0 bits
* At 10 items: ~0 bits
* At 15 items: ~1 bit
* At 20 items: ~7 bits
### Key Observations
1. **Dramatic Scaling Difference:** The LSTM's cost explodes with sequence length, reaching ~36 bits by 10 items, while both NTM variants remain below 5 bits at the same point.
2. **Crossover Point:** At the longest sequence length shown (20 items), the cost of the `NTM with Feedforward Controller` (~7 bits) surpasses that of the `NTM with LSTM Controller` (~6 bits), indicating a potential change in relative efficiency for very long sequences.
3. **Plateau Behavior:** The LSTM cost peaks around 15 items and shows a slight downward trend at 20 items, suggesting a possible saturation point or change in computational dynamics.
4. **Low-Sequence Performance:** For sequences of 6-10 items, both NTM models have a cost near zero, significantly outperforming the LSTM.
### Interpretation
This chart provides a clear visual argument for the efficiency of Neural Turing Machine (NTM) architectures over a standard LSTM when processing sequential data, particularly as the sequence length grows.
* **What the data suggests:** The LSTM model suffers from poor scalability with respect to sequence length. Its cost increases dramatically, implying it may be computationally expensive or memory-intensive for long sequences. In contrast, the NTM architectures, which are designed with explicit external memory, demonstrate far more favorable scaling. Their cost grows slowly and linearly (for the LSTM Controller variant) or remains negligible until a threshold (for the Feedforward Controller variant).
* **How elements relate:** The x-axis (sequence length) is the independent variable testing the models' scalability. The y-axis (cost in bits) is the dependent variable, likely representing a measure of computational resources, memory access, or prediction error. The diverging lines illustrate a fundamental difference in how these architectures handle increasing task complexity.
* **Notable anomalies/trends:** The most striking trend is the orders-of-magnitude difference in cost between the LSTM and NTMs. The crossover between the two NTM variants at 20 items is a critical observation, suggesting that the choice of controller within an NTM framework itself impacts scalability, and the optimal choice may depend on the expected sequence length. The LSTM's plateau is also noteworthy and could indicate a limitation in its ability to model dependencies beyond a certain length.