## Diagram: Task Demonstrations and Test
### Overview
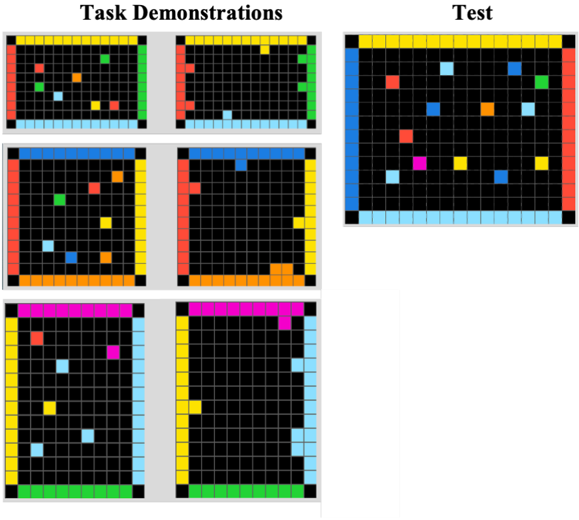
The image presents a series of grid-based environments, visually demonstrating tasks and a test scenario. The left side of the image shows six "Task Demonstrations" arranged in a 3x2 grid. The right side shows a single "Test" environment. Each environment is a grid with colored borders and colored squares within the grid.
### Components/Axes
* **Titles:**
* "Task Demonstrations" (top-left)
* "Test" (top-right)
* **Grid:** Each environment contains a grid of black squares. The grid appears to be approximately 16x16.
* **Borders:** Each environment has a colored border. The colors vary between environments.
* **Squares:** Each environment contains several colored squares within the grid. The colors and positions of these squares vary.
### Detailed Analysis
**Task Demonstrations (Left Side):**
* **Top-Left:** Border colors: Top - Yellow, Right - Green, Bottom - Light Blue, Left - Red. Contains colored squares: Green, Orange, Yellow, Light Blue, Red.
* **Top-Right:** Border colors: Top - Yellow, Right - Green, Bottom - Light Blue, Left - Red. Contains colored squares: Light Blue, Yellow.
* **Middle-Left:** Border colors: Top - Blue, Right - Yellow, Bottom - Orange, Left - Red. Contains colored squares: Red, Orange, Yellow, Light Blue.
* **Middle-Right:** Border colors: Top - Blue, Right - Yellow, Bottom - Orange, Left - Red. Contains colored squares: Blue, Orange.
* **Bottom-Left:** Border colors: Top - Pink, Right - Light Blue, Bottom - Green, Left - Red. Contains colored squares: Red, Yellow, Light Blue.
* **Bottom-Right:** Border colors: Top - Pink, Right - Light Blue, Bottom - Green, Left - Red. Contains colored squares: Yellow.
**Test (Right Side):**
* Border colors: Top - Yellow, Right - Red, Bottom - Light Blue, Left - Blue. Contains colored squares: Red, Orange, Yellow, Light Blue, Green, Pink.
### Key Observations
* The "Task Demonstrations" show different configurations of colored squares within the grid environments.
* The "Test" environment has a unique border color configuration and a different arrangement of colored squares.
* The colors used for the squares and borders are consistent across all environments.
### Interpretation
The image likely represents a reinforcement learning or pathfinding problem. The "Task Demonstrations" could be examples of successful states or actions within the environment. The "Test" environment presents a new scenario where an agent must navigate or interact with the colored squares based on the patterns learned from the demonstrations. The different border colors might represent different types of environments or constraints. The colored squares likely represent objects or goals within the environment.