\n
## Grid-Based Pattern Visualization
### Overview
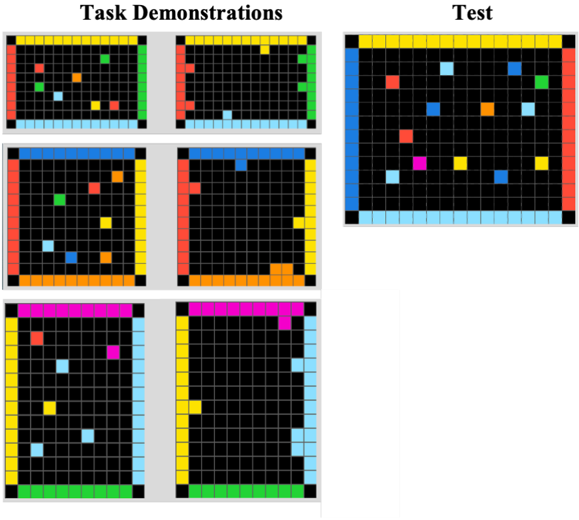
The image presents a 3x3 grid of square visualizations, each composed of a 10x10 grid of colored squares. The top row is labeled "Task Demonstrations" and the rightmost column is labeled "Test". Each square visualization contains a varying arrangement of colored squares (red, green, blue, yellow, cyan, magenta, and white) against a black background. The visualizations appear to represent patterns or configurations.
### Components/Axes
There are no explicit axes or scales. The image is organized into a grid structure. The primary components are the individual square visualizations, each containing a pattern of colored squares. The colors used are:
* Red
* Green
* Blue
* Yellow
* Cyan (light blue)
* Magenta (pink)
* White
* Black (background)
### Detailed Analysis or Content Details
Let's describe each visualization individually, noting the approximate positions of the colored squares. Note that due to the grid nature, positions are described as (row, column) where (1,1) is the top-left square.
**Task Demonstrations:**
1. **Top-Left:** Contains a green square at approximately (3,2), a red square at (4,8), a yellow square at (7,3), a cyan square at (8,7), and a magenta square at (2,9).
2. **Top-Center:** Contains a red square at (2,2), a green square at (3,7), a blue square at (6,4), a yellow square at (8,9), and a cyan square at (9,1).
3. **Top-Right (Test):** Contains a cyan square at (1,3), a magenta square at (2,6), a yellow square at (3,1), a red square at (4,8), a blue square at (5,4), a green square at (6,9), a cyan square at (7,2), a magenta square at (8,5), and a yellow square at (9,7).
4. **Middle-Left:** Contains a yellow square at (2,8), a cyan square at (3,3), a red square at (5,7), a blue square at (7,1), and a green square at (9,6).
5. **Middle-Center:** Contains a blue square at (2,1), a red square at (3,6), a yellow square at (4,9), a cyan square at (6,2), a green square at (7,8), and a magenta square at (8,3).
6. **Bottom-Left:** Contains a magenta square at (1,7), a cyan square at (3,2), a yellow square at (4,5), a red square at (6,1), and a blue square at (8,9).
7. **Middle-Right:** Contains a yellow square at (2,3), a green square at (3,8), a blue square at (5,1), a cyan square at (6,6), a magenta square at (7,9), and a red square at (9,4).
8. **Bottom-Center:** Contains a magenta square at (1,2), a cyan square at (2,7), a yellow square at (4,1), a green square at (5,6), a blue square at (7,3), and a red square at (9,8).
9. **Bottom-Right:** Contains a cyan square at (1,8), a yellow square at (2,2), a blue square at (3,7), a green square at (5,9), a magenta square at (6,4), and a red square at (8,1).
### Key Observations
The "Test" visualization (top-right) contains a greater number of colored squares than the "Task Demonstration" visualizations. The "Task Demonstration" visualizations each contain approximately 4-6 colored squares, while the "Test" visualization contains 9. The colors are distributed relatively evenly across all visualizations. There is no immediately obvious pattern or relationship between the arrangements of colored squares in the different visualizations.
### Interpretation
The image likely represents a visual learning or pattern recognition task. The "Task Demonstrations" are examples provided to a system (potentially a machine learning model) to learn a specific pattern or rule. The "Test" visualization then presents a new instance to assess the system's ability to generalize from the demonstrations. The increased complexity of the "Test" visualization (more colored squares) suggests that the task may involve identifying or reproducing patterns with varying levels of detail. The arrangement of the colored squares could represent features or attributes used for classification or prediction. Without further context, it is difficult to determine the specific nature of the task or the underlying principles governing the pattern arrangements. The image is a visual representation of data, but does not contain numerical data or statistical measures. It is a qualitative representation of patterns.