## Grid-Based Task Demonstration and Test Diagram
### Overview
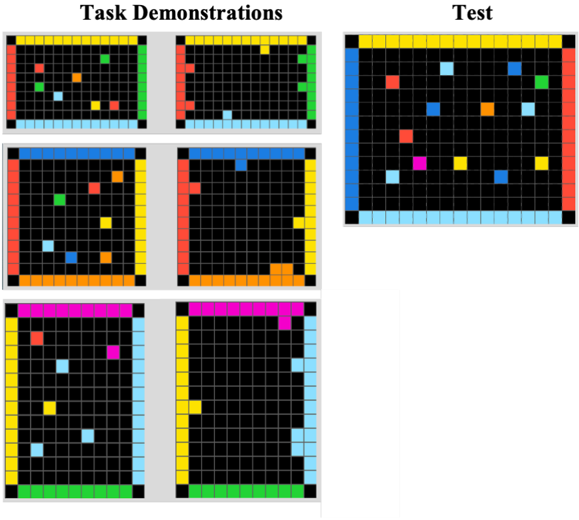
The image presents a comparative visualization of "Task Demonstrations" and "Test" phases using grid-based diagrams. Each grid cell contains colored squares (red, blue, green, yellow, pink) against black backgrounds, with colored borders framing the grids. The Test section features a larger grid with similar color patterns.
### Components/Axes
- **Main Sections**:
- **Task Demonstrations**: 6 smaller grids (2 rows × 3 columns)
- **Test**: 1 larger grid (5×5 cells)
- **Color Legend** (implicit):
- **Borders**: Red, blue, green, yellow, pink (frame grids)
- **Cell Contents**: Red, blue, green, yellow, pink (represent data points)
- **Spatial Layout**:
- Task Demonstrations occupy the left 2/3 of the image
- Test section occupies the right 1/3
- All grids share consistent cell size and border thickness
### Detailed Analysis
**Task Demonstrations**:
1. **Top Row (Red/Blue/Green Borders)**:
- Red border grid: 3 red, 2 blue, 1 green squares
- Blue border grid: 2 red, 3 blue, 1 yellow
- Green border grid: 1 red, 2 blue, 2 green, 1 yellow
2. **Bottom Row (Yellow/Pink Borders)**:
- Yellow border grid: 2 red, 1 blue, 2 yellow, 1 pink
- Pink border grid: 1 red, 3 blue, 1 green, 1 yellow
**Test Section**:
- 5×5 grid with:
- 4 red, 5 blue, 3 green, 4 yellow, 3 pink squares
- Blue border framing the entire grid
### Key Observations
1. **Color Distribution**:
- Blue squares dominate both sections (avg. 2.5/grid in Task Demonstrations vs. 5/grid in Test)
- Red squares show highest variability (1-3 per grid in demonstrations)
2. **Structural Differences**:
- Task Demonstrations use varied border colors per grid
- Test section uses uniform blue border
3. **Cell Density**:
- Test grid contains 25 cells vs. 9 cells per demonstration grid
4. **Color Consistency**:
- All colors appear in both sections but with different frequency patterns
### Interpretation
This diagram appears to illustrate a two-phase process:
1. **Task Demonstrations**: Showcase varied examples or training scenarios using color-coded categories (possibly representing different actions, statuses, or outcomes). The border colors may indicate task types or difficulty levels.
2. **Test Phase**: Represents a standardized evaluation using consistent parameters (blue border) with higher density of data points (blue squares). The Test's larger grid suggests expanded scope or increased complexity compared to demonstrations.
The color coding implies a categorical system where:
- Blue = Primary/Reference category
- Red = Secondary/Alert category
- Green/Yellow/Pink = Tertiary categories with varying significance
The Test section's uniform border and higher blue square concentration might indicate a controlled environment for evaluating performance against established patterns observed in the demonstrations. The absence of explicit numerical labels suggests this is a qualitative comparison of task execution patterns rather than quantitative measurement.