\n
## Line Chart: Cost per Sequence vs. Sequence Number
### Overview
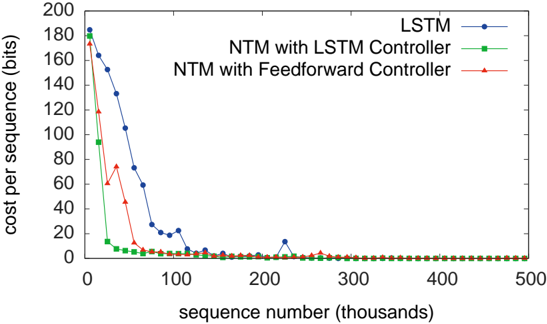
This line chart depicts the cost per sequence (in bits) as a function of the sequence number (in thousands) for three different models: LSTM, NTM with LSTM Controller, and NTM with Feedforward Controller. The chart illustrates the learning curves of these models, showing how the cost per sequence decreases as the models are trained on more sequences.
### Components/Axes
* **X-axis:** Sequence number (thousands). Scale ranges from approximately 0 to 500.
* **Y-axis:** Cost per sequence (bits). Scale ranges from approximately 0 to 200.
* **Legend:** Located in the top-right corner.
* LSTM (Blue line with circle markers)
* NTM with LSTM Controller (Green line with triangle markers)
* NTM with Feedforward Controller (Red line with plus markers)
### Detailed Analysis
* **LSTM (Blue):** The line starts at approximately 170 bits at sequence number 0. It rapidly decreases to around 20 bits by sequence number 50. It then fluctuates between approximately 10 and 25 bits, with a slight upward trend, reaching around 20 bits at sequence number 500.
* **NTM with LSTM Controller (Green):** The line begins at approximately 180 bits at sequence number 0. It quickly drops to below 10 bits by sequence number 20. It remains relatively stable, fluctuating between approximately 5 and 15 bits for the remainder of the chart, ending at around 8 bits at sequence number 500.
* **NTM with Feedforward Controller (Red):** The line starts at approximately 175 bits at sequence number 0. It decreases to around 60 bits by sequence number 20. It then continues to decrease, reaching below 10 bits by sequence number 100. It remains relatively stable, fluctuating between approximately 5 and 10 bits for the rest of the chart, ending at around 6 bits at sequence number 500.
### Key Observations
* All three models demonstrate a significant decrease in cost per sequence during the initial training phase (first 100 sequence numbers).
* The NTM with LSTM Controller and NTM with Feedforward Controller converge to lower costs per sequence than the LSTM model.
* The NTM with Feedforward Controller appears to achieve the lowest cost per sequence overall.
* The LSTM model exhibits more fluctuation in cost per sequence after the initial decrease, suggesting less stable learning.
### Interpretation
The data suggests that Neural Turing Machines (NTMs), particularly those with a Feedforward Controller, are more effective at learning the task represented by this cost function than a standard LSTM. The rapid initial decrease in cost for all models indicates that they are quickly learning the basic patterns in the data. The lower final cost and greater stability of the NTM models suggest that they are better able to generalize and retain learned information. The LSTM's fluctuating cost after the initial decrease could indicate overfitting or difficulty in capturing the underlying complexity of the data. The chart demonstrates the benefit of incorporating external memory mechanisms (as in NTMs) for sequence learning tasks. The difference between the LSTM controller and the Feedforward controller suggests that the Feedforward controller is more efficient for this specific task.