## Stacked Bar Chart: CPU vs Heterogeneous (CPU-GPU-NPU) Performance Comparison
### Overview
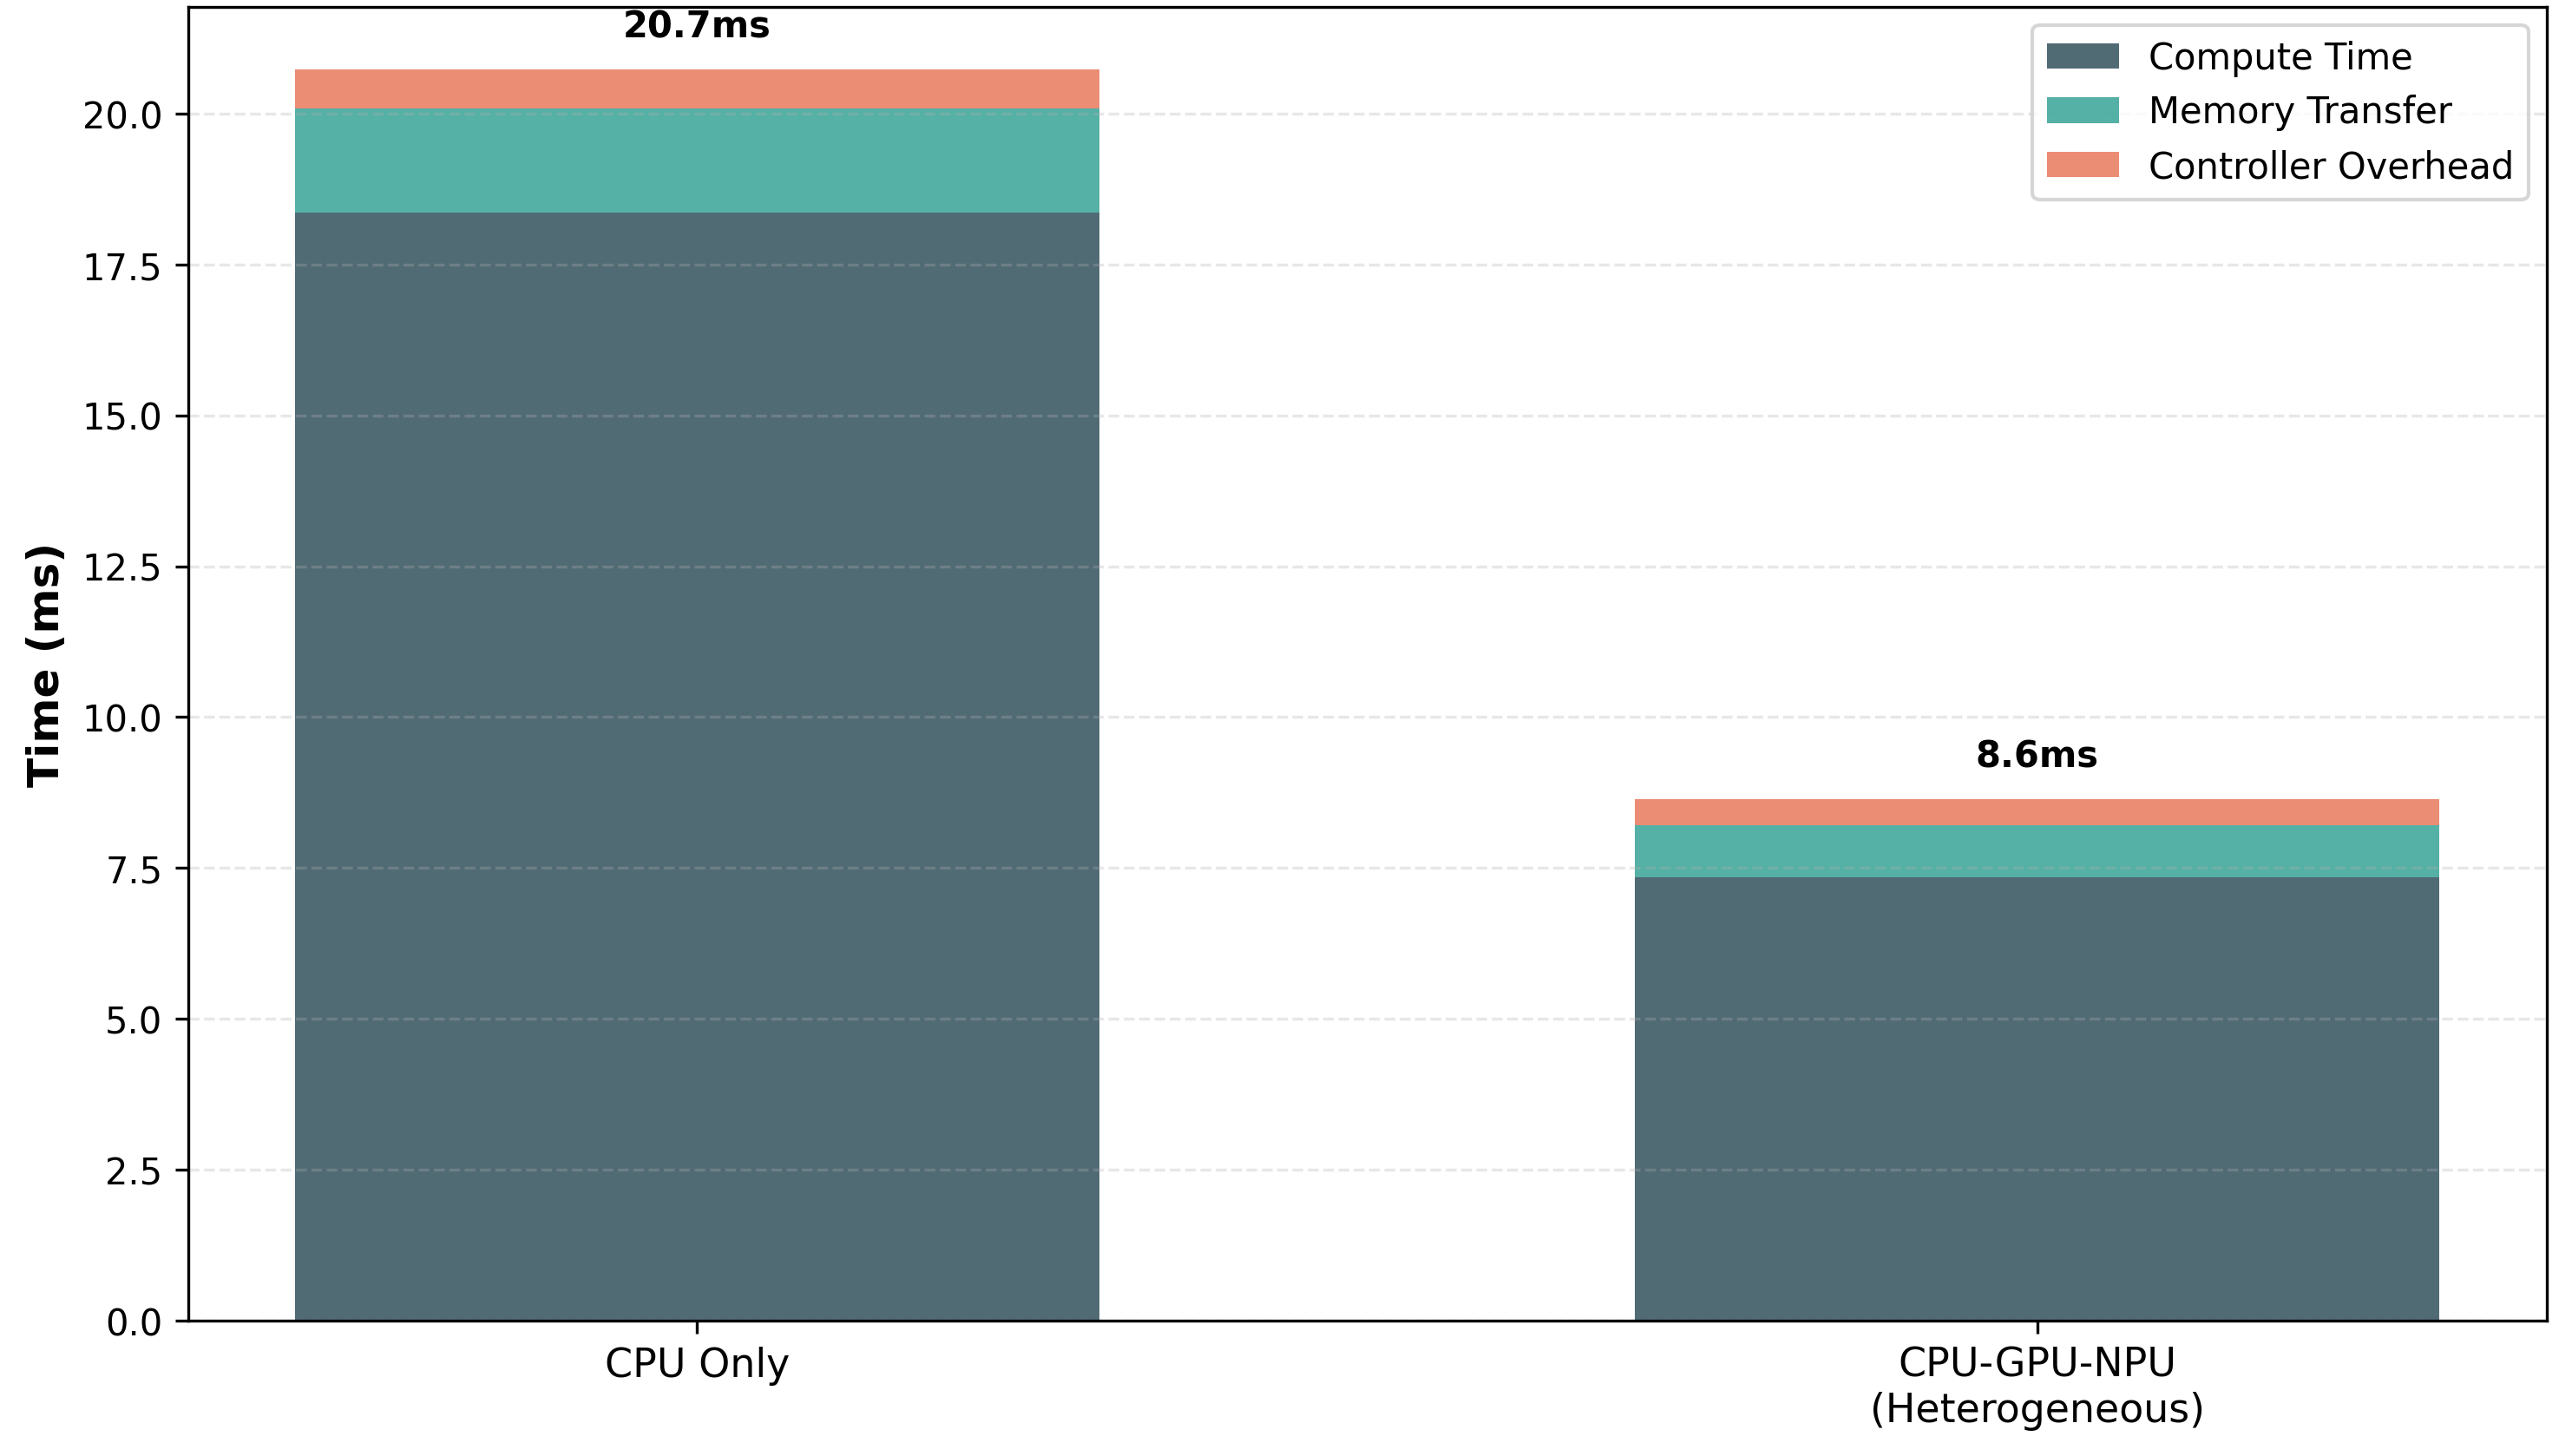
The chart compares computational performance between two scenarios: "CPU Only" and "CPU-GPU-NPU (Heterogeneous)" across three components: Compute Time, Memory Transfer, and Controller Overhead. Total execution times are 20.7ms (CPU Only) and 8.6ms (Heterogeneous).
### Components/Axes
- **X-axis**: Categories labeled "CPU Only" (left) and "CPU-GPU-NPU (Heterogeneous)" (right)
- **Y-axis**: Time in milliseconds (0–20ms, increments of 2.5ms)
- **Legend**:
- Dark blue = Compute Time
- Teal = Memory Transfer
- Orange = Controller Overhead
- **Title**: Positioned at the top center, displaying total times (20.7ms/8.6ms)
### Detailed Analysis
1. **CPU Only (20.7ms total)**:
- **Compute Time**: ~18.0ms (dark blue, 87% of total)
- **Memory Transfer**: ~2.0ms (teal, 9.7%)
- **Controller Overhead**: ~0.7ms (orange, 3.4%)
2. **CPU-GPU-NPU (8.6ms total)**:
- **Compute Time**: ~7.5ms (dark blue, 87% of total)
- **Memory Transfer**: ~0.8ms (teal, 9.3%)
- **Controller Overhead**: ~0.3ms (orange, 3.5%)
### Key Observations
- Compute Time dominates both scenarios but decreases by **58%** in the heterogeneous case (18.0ms → 7.5ms).
- Memory Transfer and Controller Overhead remain relatively stable as proportions but decrease absolutely (2.0ms → 0.8ms; 0.7ms → 0.3ms).
- Heterogeneous configuration reduces total time by **58%** (20.7ms → 8.6ms).
### Interpretation
The data demonstrates that offloading computation to GPU/NPU significantly improves performance while maintaining similar overhead proportions. The **Compute Time reduction** (58%) is the primary driver of efficiency gains, suggesting that heterogeneous architectures effectively parallelize workloads. Despite increased system complexity, Memory Transfer and Controller Overhead remain minor contributors (<10% each), indicating that the benefits of parallel processing outweigh the associated costs. This aligns with principles of Amdahl's Law, where speedup is limited by sequential portions of the task.