## Stacked Bar Chart: Performance Comparison of CPU-Only vs. Heterogeneous Computing
### Overview
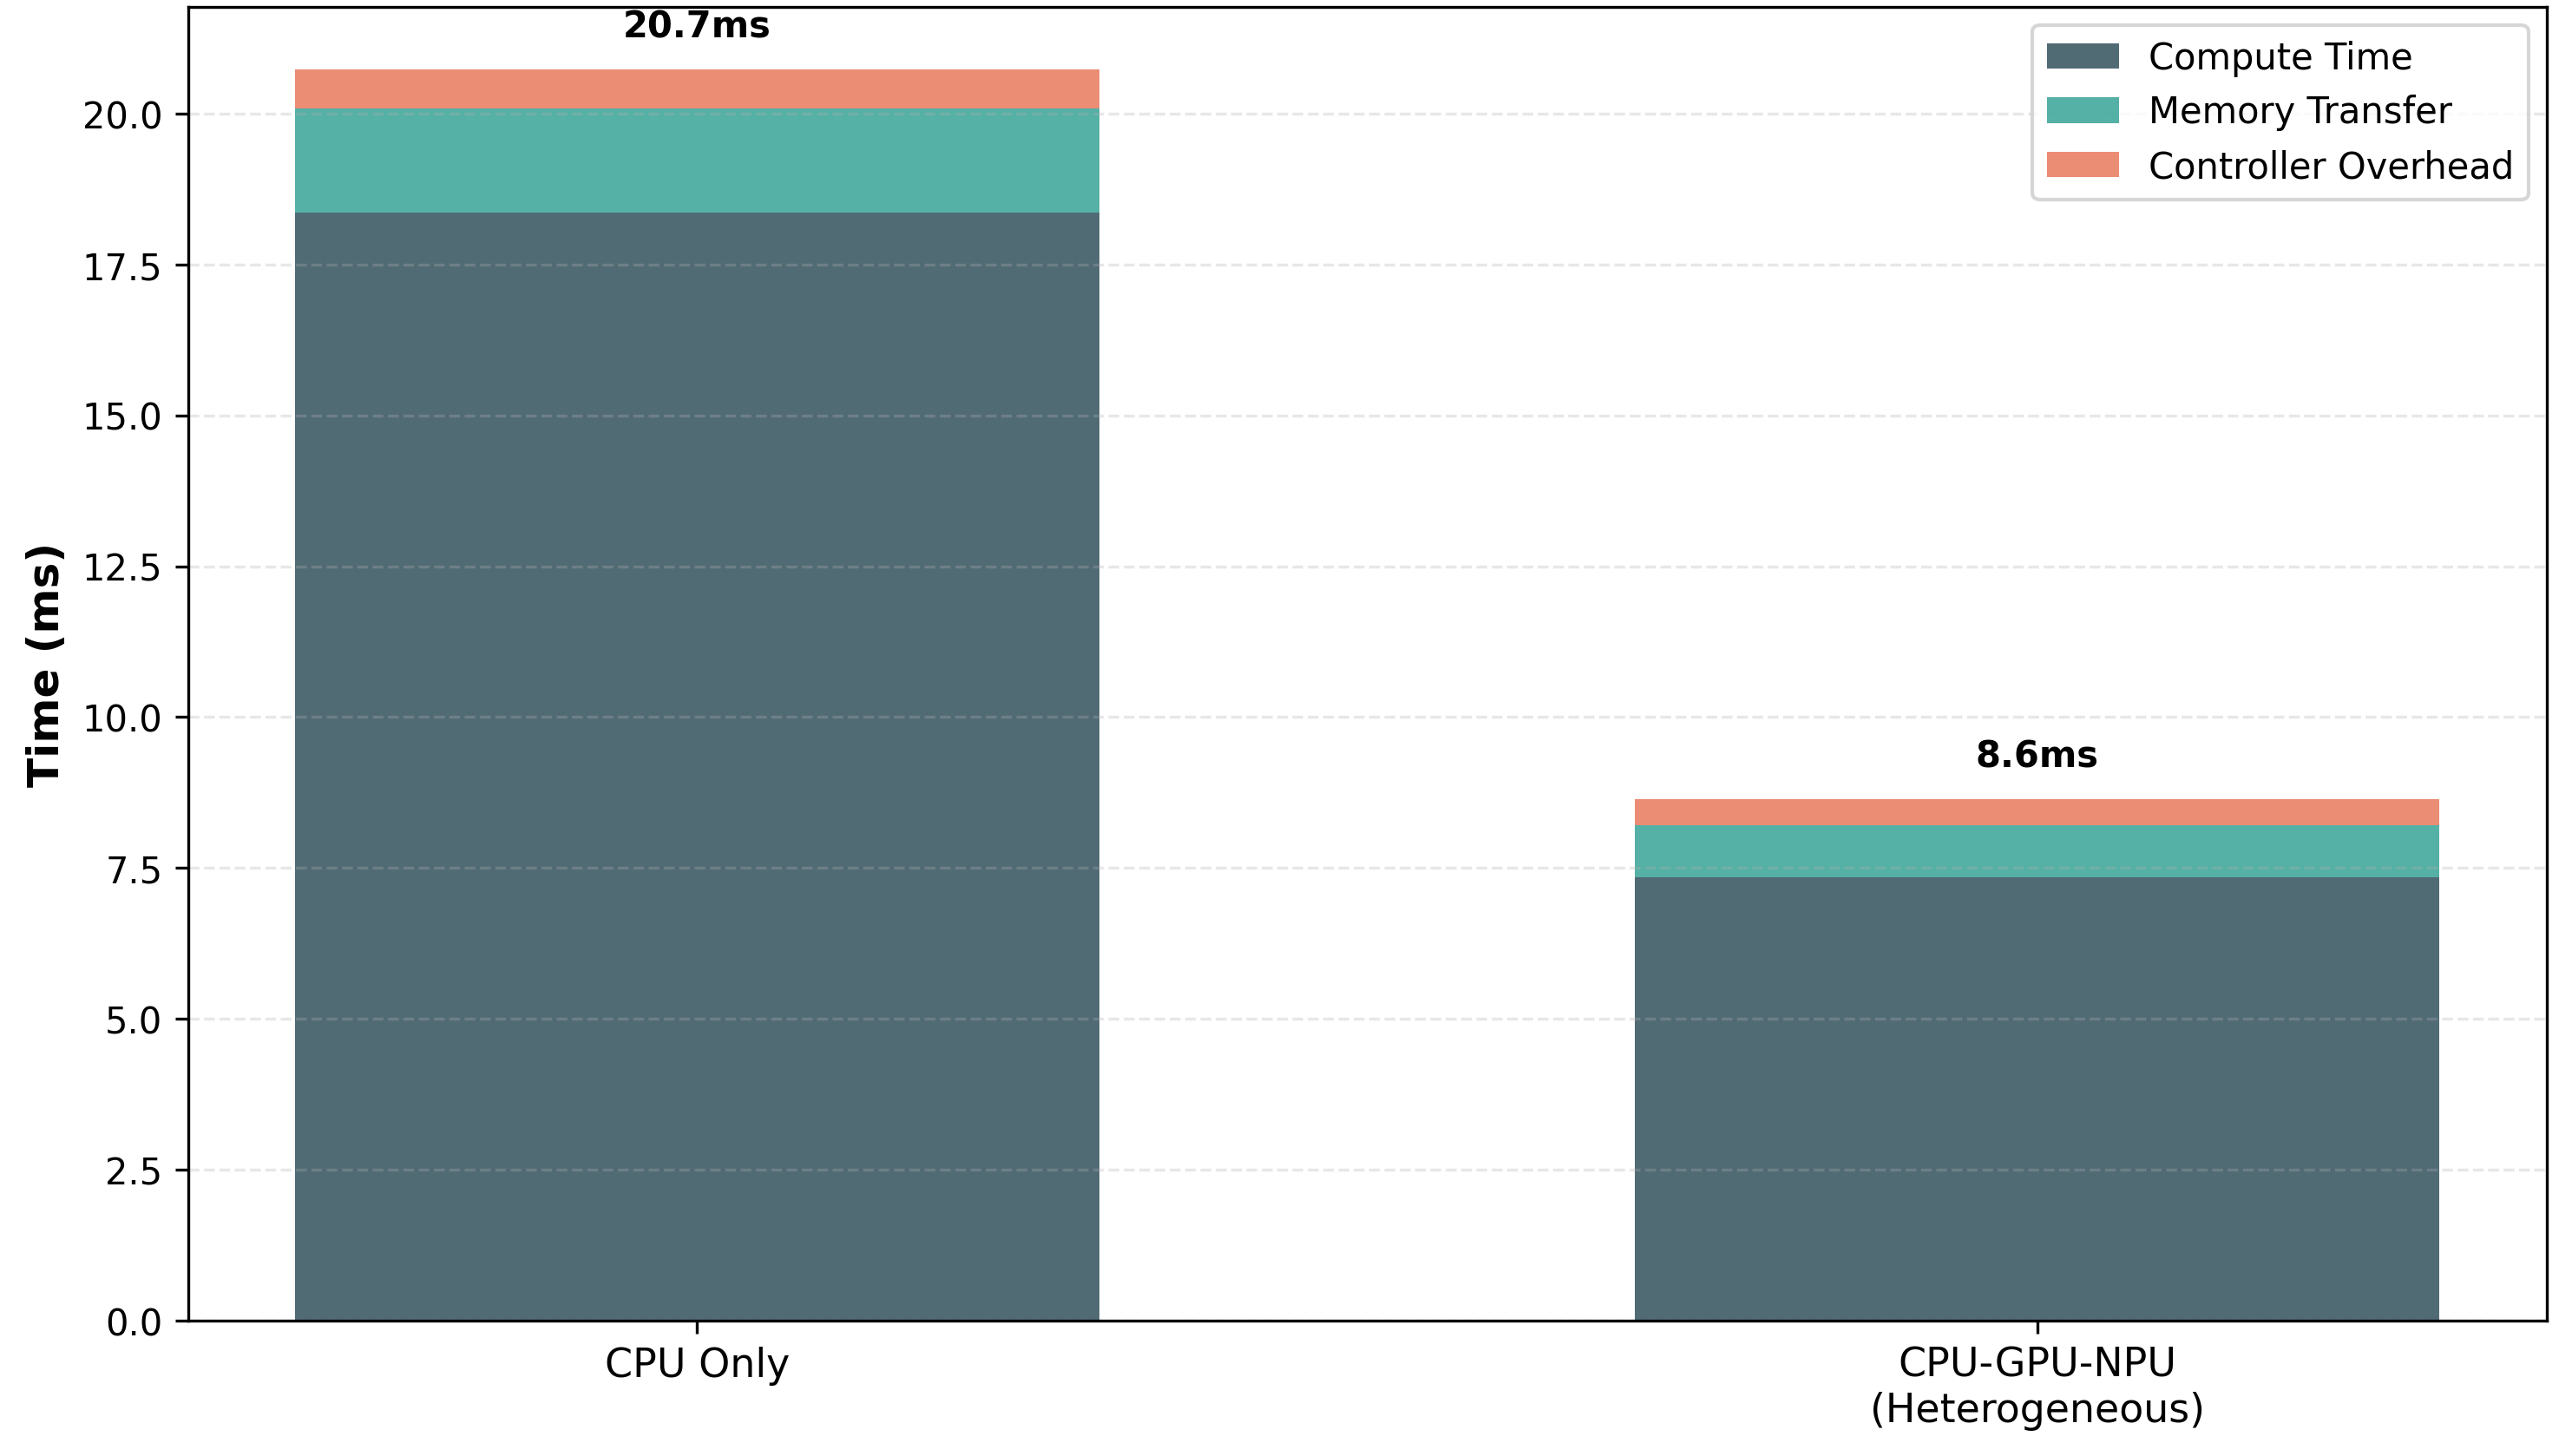
The image displays a stacked bar chart comparing the total execution time (in milliseconds) and its constituent components for two different computing architectures: a "CPU Only" system and a "CPU-GPU-NPU (Heterogeneous)" system. The chart visually demonstrates a significant performance improvement when using a heterogeneous computing approach.
### Components/Axes
* **Chart Type:** Stacked Bar Chart.
* **Y-Axis:** Labeled **"Time (ms)"**. The scale runs from 0.0 to 20.0, with major gridlines at intervals of 2.5 ms (0.0, 2.5, 5.0, 7.5, 10.0, 12.5, 15.0, 17.5, 20.0).
* **X-Axis:** Contains two categorical bars:
1. **"CPU Only"** (left bar)
2. **"CPU-GPU-NPU (Heterogeneous)"** (right bar)
* **Legend:** Positioned in the **top-right corner** of the chart area. It defines the three stacked components:
* **Compute Time:** Represented by a **dark gray** color.
* **Memory Transfer:** Represented by a **teal/green** color.
* **Controller Overhead:** Represented by a **salmon/light red** color.
* **Data Labels:** The total time for each bar is displayed directly above it:
* Above "CPU Only": **20.7ms**
* Above "CPU-GPU-NPU": **8.6ms**
### Detailed Analysis
**1. CPU Only Bar (Total: 20.7ms)**
* **Compute Time (Dark Gray):** This is the largest component. The segment starts at 0.0 ms and extends to approximately **18.3 ms**.
* **Memory Transfer (Teal):** This segment sits atop the Compute Time. It starts at ~18.3 ms and ends at approximately **20.1 ms**, indicating a duration of about **1.8 ms**.
* **Controller Overhead (Salmon):** This is the topmost segment. It starts at ~20.1 ms and ends at the labeled total of **20.7 ms**, indicating a duration of about **0.6 ms**.
**2. CPU-GPU-NPU (Heterogeneous) Bar (Total: 8.6ms)**
* **Compute Time (Dark Gray):** Again the largest component, but significantly reduced. The segment starts at 0.0 ms and extends to approximately **7.4 ms**.
* **Memory Transfer (Teal):** This segment sits atop the Compute Time. It starts at ~7.4 ms and ends at approximately **8.2 ms**, indicating a duration of about **0.8 ms**.
* **Controller Overhead (Salmon):** The topmost segment. It starts at ~8.2 ms and ends at the labeled total of **8.6 ms**, indicating a duration of about **0.4 ms**.
### Key Observations
* **Total Time Reduction:** The heterogeneous system reduces the total execution time by **~58.5%** (from 20.7ms to 8.6ms).
* **Compute Time Dominance:** In both architectures, "Compute Time" is the dominant cost, accounting for the vast majority of the total time.
* **Proportional Changes:** While all components decrease in absolute time, the reduction in "Compute Time" is the most dramatic, dropping by over 10ms. "Memory Transfer" time is roughly halved, and "Controller Overhead" sees a modest reduction.
* **Visual Trend:** The "CPU Only" bar is more than twice the height of the "CPU-GPU-NPU" bar, providing a clear visual cue of the performance advantage.
### Interpretation
This chart provides strong empirical evidence for the efficacy of heterogeneous computing (combining CPU, GPU, and NPU) for the measured workload. The data suggests that offloading computational tasks to specialized processors (GPU/NPU) drastically reduces the primary bottleneck—"Compute Time." The associated reductions in "Memory Transfer" and "Controller Overhead" time, while smaller in absolute terms, indicate a more efficient overall system orchestration. The outlier is not a data point but the architecture itself: the heterogeneous approach is the clear solution for minimizing latency in this context. The chart effectively communicates that the performance gain is not from optimizing a single component but from a systemic redesign of how the computation is scheduled and executed across different processing units.