## Diagram: Process Flow
### Overview
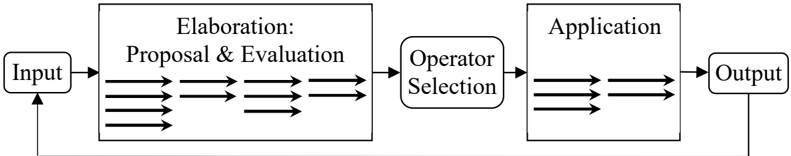
The image is a diagram illustrating a process flow. It consists of rectangular and rounded-corner boxes representing different stages, connected by arrows indicating the direction of flow. The process starts with an "Input," goes through "Elaboration: Proposal & Evaluation," "Operator Selection," and "Application," and ends with an "Output." A feedback loop connects the "Output" back to the "Input."
### Components/Axes
* **Input:** A rounded-corner rectangular box on the left, representing the starting point of the process.
* **Elaboration: Proposal & Evaluation:** A rectangular box to the right of "Input," representing the stage where proposals are made and evaluated.
* **Operator Selection:** A rounded-corner rectangular box to the right of "Elaboration," representing the stage where an operator is selected.
* **Application:** A rectangular box to the right of "Operator Selection," representing the stage where the selected operator is applied.
* **Output:** A rounded-corner rectangular box on the right, representing the end point of the process.
* **Arrows:** Black arrows connecting the boxes, indicating the flow of the process. There are multiple parallel arrows between "Input" and "Elaboration," "Elaboration" and "Operator Selection," and "Application" and "Output," suggesting multiple parallel processes or options. A single arrow connects "Operator Selection" and "Application." A single arrow also connects "Output" back to "Input," forming a feedback loop.
### Detailed Analysis
* The process begins with an "Input."
* The "Input" leads to "Elaboration: Proposal & Evaluation," where multiple proposals are evaluated. The number of parallel arrows suggests multiple proposals or parallel processing.
* From "Elaboration," the process moves to "Operator Selection," where a single operator is chosen.
* The selected operator is then applied in the "Application" stage.
* The "Application" stage leads to an "Output."
* The "Output" is fed back into the "Input," creating a feedback loop.
### Key Observations
* The diagram illustrates a cyclical process with a feedback loop.
* The "Elaboration" and "Application" stages involve multiple parallel processes or options, as indicated by the multiple arrows.
* The "Operator Selection" stage involves a single operator being chosen.
### Interpretation
The diagram represents a process that involves generating and evaluating multiple proposals, selecting an operator, applying the operator, and then feeding the results back into the process for further refinement or iteration. The feedback loop suggests a continuous improvement or learning process. The multiple parallel arrows indicate that the process can handle multiple inputs or options simultaneously. The diagram could represent a variety of processes, such as a design process, a decision-making process, or a control system.