\n
## Heatmap: Layer Activation vs. Token Influence
### Overview
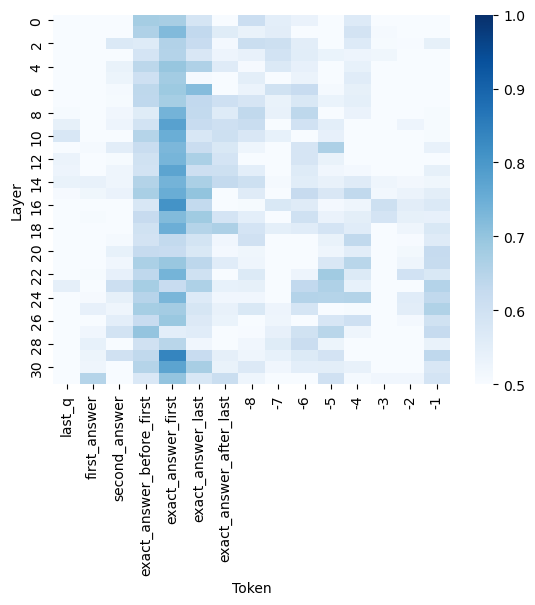
The image presents a heatmap visualizing the relationship between layers in a neural network and the influence of different tokens. The heatmap uses a color gradient to represent values ranging from 0.5 to 1.0, indicating the strength of the relationship. The x-axis represents tokens, and the y-axis represents layers.
### Components/Axes
* **X-axis (Horizontal):** "Token" with markers ranging from -8 to "last\_q". Specific tokens include: "last\_q", "first\_answer", "second\_answer", "exact\_answer\_before\_first", "exact\_answer\_first", "exact\_answer\_after\_last", and numerical tokens from -8 to -1.
* **Y-axis (Vertical):** "Layer" with markers ranging from 0 to 30, incrementing by 2.
* **Color Scale (Right):** Represents the value of the heatmap cells. The scale ranges from 0.5 (lightest blue) to 1.0 (darkest blue).
* **Legend:** Located on the right side of the image, the color scale provides a mapping between color intensity and numerical value.
### Detailed Analysis
The heatmap shows varying levels of activation between layers and tokens. The highest activation values (darkest blue, approximately 1.0) are concentrated in the upper-left portion of the heatmap, corresponding to lower layer numbers (0-8) and the tokens "first\_answer" and "second\_answer".
Here's a breakdown of approximate values, reading from left to right and top to bottom:
* **last\_q:** Layer 0: ~0.95, Layer 2: ~0.85, Layer 4: ~0.75, Layer 6: ~0.7, Layer 8: ~0.65, Layer 10: ~0.6, Layer 12: ~0.6, Layer 14: ~0.6, Layer 16: ~0.6, Layer 18: ~0.6, Layer 20: ~0.6, Layer 22: ~0.6, Layer 24: ~0.6, Layer 26: ~0.6, Layer 28: ~0.6, Layer 30: ~0.6
* **first\_answer:** Layer 0: ~1.0, Layer 2: ~0.95, Layer 4: ~0.9, Layer 6: ~0.8, Layer 8: ~0.7, Layer 10: ~0.65, Layer 12: ~0.6, Layer 14: ~0.6, Layer 16: ~0.6, Layer 18: ~0.6, Layer 20: ~0.6, Layer 22: ~0.6, Layer 24: ~0.6, Layer 26: ~0.6, Layer 28: ~0.6, Layer 30: ~0.6
* **second\_answer:** Layer 0: ~1.0, Layer 2: ~0.95, Layer 4: ~0.9, Layer 6: ~0.8, Layer 8: ~0.7, Layer 10: ~0.65, Layer 12: ~0.6, Layer 14: ~0.6, Layer 16: ~0.6, Layer 18: ~0.6, Layer 20: ~0.6, Layer 22: ~0.6, Layer 24: ~0.6, Layer 26: ~0.6, Layer 28: ~0.6, Layer 30: ~0.6
* **exact\_answer\_before\_first:** Layer 0: ~0.8, Layer 2: ~0.8, Layer 4: ~0.7, Layer 6: ~0.65, Layer 8: ~0.6, Layer 10: ~0.6, Layer 12: ~0.6, Layer 14: ~0.6, Layer 16: ~0.6, Layer 18: ~0.6, Layer 20: ~0.6, Layer 22: ~0.6, Layer 24: ~0.6, Layer 26: ~0.6, Layer 28: ~0.6, Layer 30: ~0.6
* **exact\_answer\_first:** Layer 0: ~0.9, Layer 2: ~0.9, Layer 4: ~0.8, Layer 6: ~0.7, Layer 8: ~0.65, Layer 10: ~0.6, Layer 12: ~0.6, Layer 14: ~0.6, Layer 16: ~0.6, Layer 18: ~0.6, Layer 20: ~0.6, Layer 22: ~0.6, Layer 24: ~0.6, Layer 26: ~0.6, Layer 28: ~0.6, Layer 30: ~0.6
* **exact\_answer\_after\_last:** Layer 0: ~0.7, Layer 2: ~0.7, Layer 4: ~0.6, Layer 6: ~0.6, Layer 8: ~0.6, Layer 10: ~0.6, Layer 12: ~0.6, Layer 14: ~0.6, Layer 16: ~0.6, Layer 18: ~0.6, Layer 20: ~0.6, Layer 22: ~0.6, Layer 24: ~0.6, Layer 26: ~0.6, Layer 28: ~0.6, Layer 30: ~0.6
* **-8 to -1:** These tokens generally show lower activation values (lighter blues, around 0.5-0.7) across all layers.
### Key Observations
* The activation values generally decrease as the layer number increases, suggesting that the influence of these tokens diminishes in deeper layers of the network.
* "first\_answer" and "second\_answer" exhibit the strongest activation, particularly in the initial layers.
* The numerical tokens (-8 to -1) consistently show lower activation values compared to the named tokens.
* There is a clear gradient of activation, with the top-left corner representing the highest influence and the bottom-right corner representing the lowest.
### Interpretation
This heatmap likely represents the attention weights or activation patterns within a transformer-based model, possibly a question-answering system. The tokens represent different parts of the input sequence (e.g., question, answer candidates), and the layers represent the different stages of processing within the model.
The high activation values for "first\_answer" and "second\_answer" in the early layers suggest that the model quickly focuses on these tokens when processing the input. The decreasing activation values in deeper layers indicate that the model refines its focus as it processes the information. The lower activation values for the numerical tokens suggest that these tokens are less important for the model's decision-making process.
The heatmap provides insights into how the model attends to different parts of the input sequence at different stages of processing. This information can be used to understand the model's behavior, identify potential biases, and improve its performance. The consistent decline in activation across layers suggests a hierarchical processing of information, where initial layers capture broad features and later layers refine the focus.