# Anthropic-HH Dialogue Win Rate vs Chosen
## Axis Labels
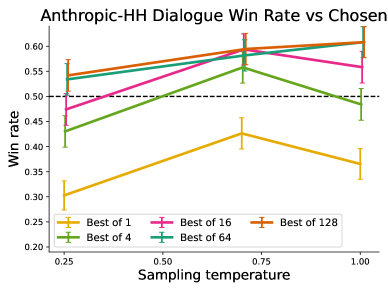
- **X-axis**: Sampling temperature (0.25 to 1.00)
- **Y-axis**: Win rate (0.20 to 0.60)
## Legend
- **Best of 1**: Yellow line with square markers
- **Best of 4**: Green line with triangle markers
- **Best of 16**: Pink line with diamond markers
- **Best of 64**: Teal line with circle markers
- **Best of 128**: Orange line with pentagon markers
## Key Trends and Data Points
1. **Best of 1** (Yellow):
- Starts at ~0.30 win rate at 0.25 sampling temperature.
- Increases steadily to ~0.45 at 1.00 sampling temperature.
- Error bars: ~±0.05 at 0.25, ~±0.03 at 1.00.
2. **Best of 4** (Green):
- Begins at ~0.45 win rate at 0.25 sampling temperature.
- Peaks at ~0.55 at 0.75 sampling temperature.
- Drops to ~0.48 at 1.00 sampling temperature.
- Error bars: ~±0.05 at 0.25, ~±0.04 at 0.75, ~±0.03 at 1.00.
3. **Best of 16** (Pink):
- Starts at ~0.48 win rate at 0.25 sampling temperature.
- Rises to ~0.58 at 0.75 sampling temperature.
- Slightly declines to ~0.56 at 1.00 sampling temperature.
- Error bars: ~±0.04 at 0.25, ~±0.03 at 0.75, ~±0.04 at 1.00.
4. **Best of 64** (Teal):
- Starts at ~0.53 win rate at 0.25 sampling temperature.
- Remains relatively flat, peaking at ~0.58 at 0.75 sampling temperature.
- Slightly decreases to ~0.57 at 1.00 sampling temperature.
- Error bars: ~±0.03 at 0.25, ~±0.02 at 0.75, ~±0.03 at 1.00.
5. **Best of 128** (Orange):
- Begins at ~0.54 win rate at 0.25 sampling temperature.
- Increases steadily to ~0.60 at 1.00 sampling temperature.
- Error bars: ~±0.04 at 0.25, ~±0.02 at 1.00.
## Observations
- Higher "Best of" values (e.g., 64, 128) generally show higher win rates and tighter error margins.
- Sampling temperature has a non-linear impact: performance often peaks at intermediate values (e.g., 0.75) before plateauing or declining.
- The **Best of 128** line consistently outperforms others across all sampling temperatures.
- Error bars indicate decreasing uncertainty with higher "Best of" values and sampling temperatures.