## Flowchart Diagram: Process Evolution Stages
### Overview
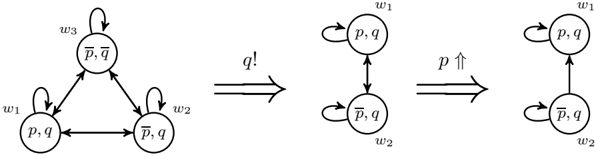
The image depicts a three-stage flowchart illustrating a transformation process. The diagrams use nodes (circles) connected by directed arrows with labels, showing transitions between states labeled with variables and operators.
### Components/Axes
- **Nodes**:
- Stage 1: Three nodes labeled `p,q`, `p̄,q`, and `p̄,q` (with a bar over `p`).
- Stage 2: Two nodes labeled `p,q` and `p̄,q`.
- Stage 3: Two nodes labeled `p,q` and `p̄,q` (same as Stage 2).
- **Arrows**:
- Stage 1: Arrows labeled `w1`, `w2`, `w3` forming a triangular loop between nodes.
- Transition 1: Arrow labeled `q!` connecting Stage 1 to Stage 2.
- Transition 2: Arrow labeled `p↑` connecting Stage 2 to Stage 3.
- Stage 2/3: Arrows labeled `w1` and `w2` connecting nodes in a linear flow.
### Detailed Analysis
1. **Stage 1 (Triangular Structure)**:
- Nodes: `p,q` (top), `p̄,q` (left), `p̄,q` (right).
- Arrows:
- `w1`: Connects `p,q` → `p̄,q` (left).
- `w2`: Connects `p̄,q` (left) → `p̄,q` (right).
- `w3`: Connects `p̄,q` (right) → `p,q` (top).
- Implication: A cyclic interaction among three states with equal-weight transitions (`w1`, `w2`, `w3`).
2. **Transition 1 (`q!`)**:
- Collapses the triangular structure into a linear chain:
- `p,q` → `p̄,q` via `w1` (retained).
- `p̄,q` → `p̄,q` via `w2` (retained).
- `q!` suggests a transformation or output derived from the initial interactions.
3. **Stage 2 (Linear Chain)**:
- Nodes: `p,q` (top), `p̄,q` (bottom).
- Arrows:
- `w1`: `p,q` → `p̄,q`.
- `w2`: `p̄,q` → `p̄,q` (self-loop).
- `p↑` indicates a promotion or elevation of `p` to a higher state.
4. **Transition 2 (`p↑`)**:
- Maintains the linear structure but emphasizes the upward movement of `p` (possibly a priority or optimization step).
5. **Stage 3 (Simplified Linear Flow)**:
- Identical node labels to Stage 2 but with arrows `w1` and `w2` reinforcing the linear progression.
- Suggests stabilization or finalization of the process.
### Key Observations
- **Simplification**: The process evolves from a complex cyclic system (Stage 1) to a streamlined linear flow (Stages 2–3).
- **Critical Transitions**:
- `q!`: Represents a pivotal output or result from the initial interactions.
- `p↑`: Highlights a focus on optimizing or elevating the `p` component.
- **Repetition**: The reuse of `w1` and `w2` in later stages implies these transitions are foundational to the process.
### Interpretation
The diagrams likely model a system where initial complexity (Stage 1) is reduced to a focused, optimized workflow. The labels `w1`, `w2`, and `w3` may represent weights, probabilities, or operational steps. The `q!` and `p↑` transitions suggest critical milestones: `q!` could denote a derived outcome, while `p↑` emphasizes prioritization. The self-loop `w2` in Stages 2–3 might indicate iterative refinement or stabilization. This structure aligns with process optimization frameworks, where redundancy is eliminated, and key variables are elevated for efficiency.