TECHNICAL ASSET FINGERPRINT
443ff3852102c4cda68280a8
Click to view fullscreen
Press ESC or click to close
FOUND IN PAPERS
EXPERT: nemotron-free VERSION 1
RUNTIME: free/nvidia/nemotron-nano-12b-v2-vl:free
INTEL_VERIFIED
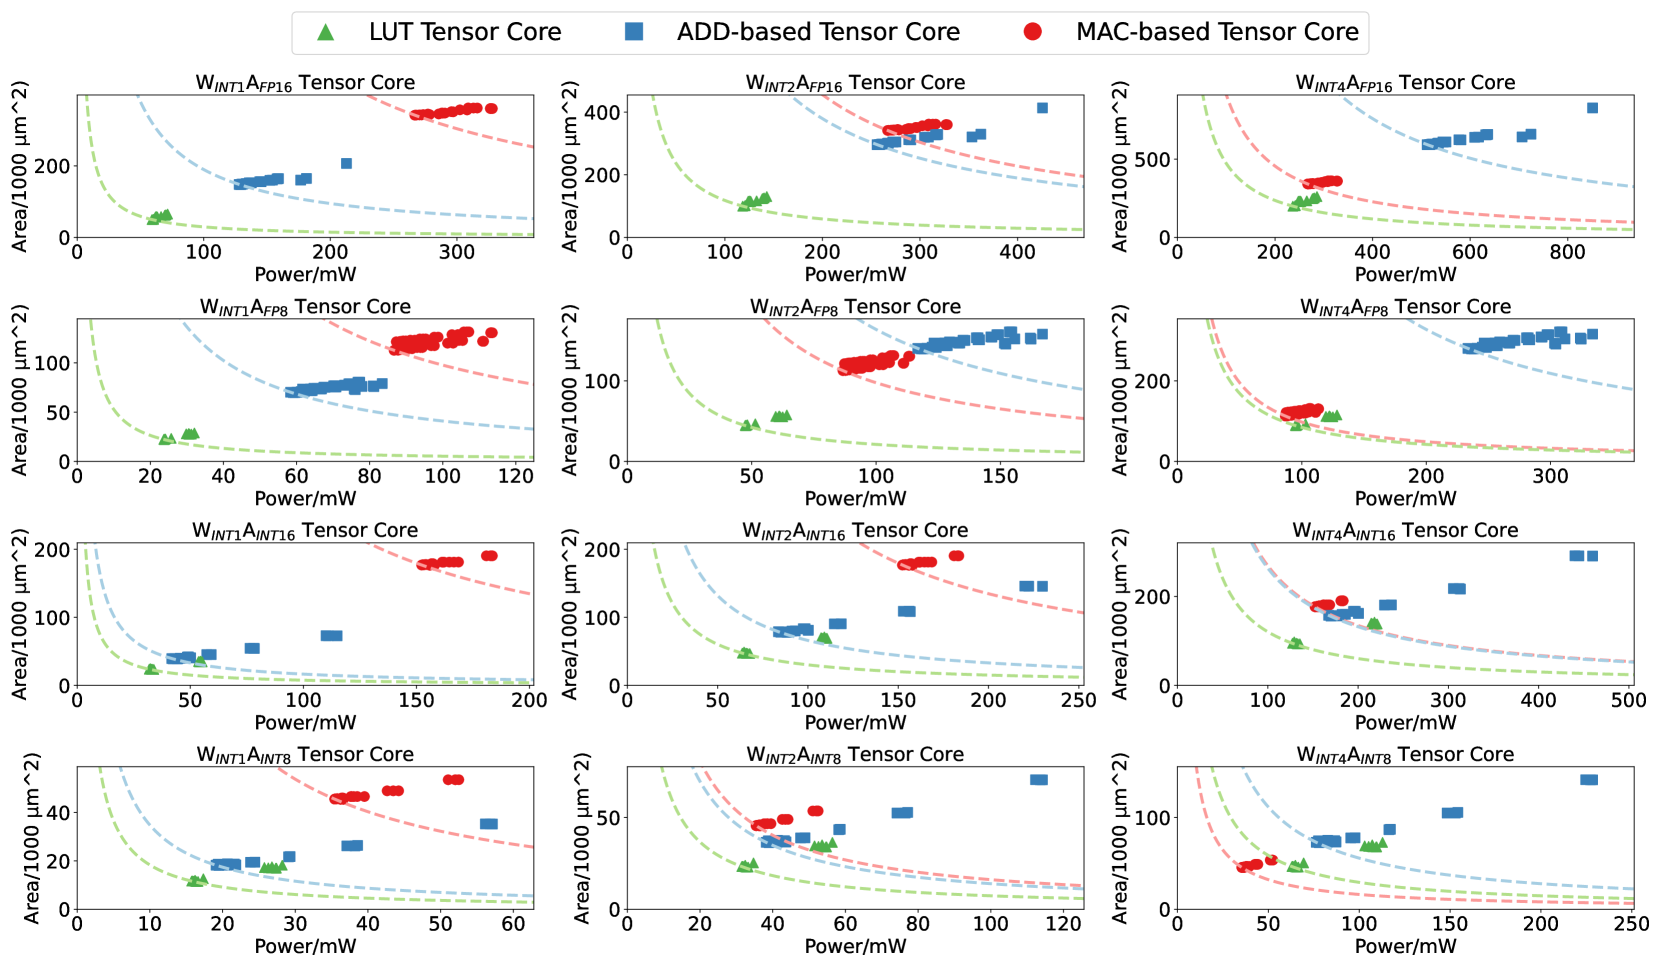
## Chart/Diagram Type: Performance Trade-off Analysis of Tensor Core Architectures
### Overview
The image contains 12 comparative graphs arranged in a 3x4 grid, analyzing the relationship between **power consumption (mW)** and **area efficiency (Area/1000 µm²)** for three tensor core architectures: **LUT Tensor Core** (green triangles), **ADD-based Tensor Core** (blue squares), and **MAC-based Tensor Core** (red circles). Each graph corresponds to a specific configuration (e.g., "W_INT1A_FP16", "W_INT2A_FP8") and includes dashed reference lines in green, blue, and red.
### Components/Axes
- **X-axis**: Power/mW (ranges from 0 to 300, 400, 600, or 250 mW depending on the graph).
- **Y-axis**: Area/1000 µm² (ranges from 0 to 200, 400, 500, or 200 µm² depending on the graph).
- **Legends**:
- Green triangles: LUT Tensor Core
- Blue squares: ADD-based Tensor Core
- Red circles: MAC-based Tensor Core
- **Dashed Lines**:
- Green: Likely represents an optimal or theoretical efficiency curve for LUT cores.
- Blue: Likely represents an optimal or theoretical efficiency curve for ADD-based cores.
- Red: Likely represents an optimal or theoretical efficiency curve for MAC-based cores.
### Detailed Analysis
#### Graph 1: W_INT1A_FP16 Tensor Core
- **Power Range**: 0–300 mW
- **Area Range**: 0–200 µm²
- **Data Points**:
- LUT (green): 10–50 mW, 10–50 µm²
- ADD-based (blue): 50–200 mW, 50–150 µm²
- MAC-based (red): 200–300 mW, 150–200 µm²
- **Trends**:
- LUT cores show the lowest power-area trade-off.
- MAC-based cores require significantly higher power and area.
- Dashed lines suggest theoretical efficiency thresholds.
#### Graph 2: W_INT1A_FP8 Tensor Core
- **Power Range**: 0–120 mW
- **Area Range**: 0–100 µm²
- **Data Points**:
- LUT (green): 10–30 mW, 10–30 µm²
- ADD-based (blue): 30–100 mW, 30–80 µm²
- MAC-based (red): 80–120 mW, 70–100 µm²
- **Trends**:
- LUT cores dominate in efficiency.
- MAC-based cores cluster near the upper-right corner.
#### Graph 3: W_INT4A_FP16 Tensor Core
- **Power Range**: 0–600 mW
- **Area Range**: 0–500 µm²
- **Data Points**:
- LUT (green): 50–200 mW, 50–200 µm²
- ADD-based (blue): 200–400 mW, 200–400 µm²
- MAC-based (red): 400–600 mW, 400–500 µm²
- **Trends**:
- MAC-based cores occupy the highest power-area quadrant.
- Dashed lines indicate diminishing returns at higher power levels.
#### Graph 4: W_INT4A_FP8 Tensor Core
- **Power Range**: 0–250 mW
- **Area Range**: 0–200 µm²
- **Data Points**:
- LUT (green): 20–100 mW, 20–100 µm²
- ADD-based (blue): 100–250 mW, 100–200 µm²
- MAC-based (red): 200–250 mW, 180–200 µm²
- **Trends**:
- LUT cores maintain a linear efficiency curve.
- MAC-based cores show minimal improvement beyond 200 mW.
#### Graph 5: W_INT2A_FP16 Tensor Core
- **Power Range**: 0–400 mW
- **Area Range**: 0–400 µm²
- **Data Points**:
- LUT (green): 50–200 mW, 50–200 µm²
- ADD-based (blue): 200–400 mW, 200–400 µm²
- MAC-based (red): 300–400 mW, 300–400 µm²
- **Trends**:
- MAC-based cores align closely with the red dashed line.
- ADD-based cores show a steeper power-area slope.
#### Graph 6: W_INT2A_FP8 Tensor Core
- **Power Range**: 0–150 mW
- **Area Range**: 0–200 µm²
- **Data Points**:
- LUT (green): 10–60 mW, 10–60 µm²
- ADD-based (blue): 60–150 mW, 60–150 µm²
- MAC-based (red): 120–150 mW, 120–150 µm²
- **Trends**:
- LUT cores remain the most efficient.
- MAC-based cores cluster near the upper boundary.
#### Graph 7: W_INT1A_FP16 (Repeated)
- **Power Range**: 0–200 mW
- **Area Range**: 0–200 µm²
- **Data Points**:
- LUT (green): 10–50 mW, 10–50 µm²
- ADD-based (blue): 50–150 mW, 50–150 µm²
- MAC-based (red): 150–200 mW, 150–200 µm²
- **Trends**:
- Similar to Graph 1 but with a narrower power range.
#### Graph 8: W_INT1A_FP8 (Repeated)
- **Power Range**: 0–60 mW
- **Area Range**: 0–40 µm²
- **Data Points**:
- LUT (green): 5–20 mW, 5–20 µm²
- ADD-based (blue): 20–60 mW, 20–40 µm²
- MAC-based (red): 40–60 mW, 30–40 µm²
- **Trends**:
- LUT cores dominate at low power.
- MAC-based cores show minimal area growth.
#### Graph 9: W_INT4A_FP16 (Repeated)
- **Power Range**: 0–500 mW
- **Area Range**: 0–200 µm²
- **Data Points**:
- LUT (green): 50–200 mW, 50–200 µm²
- ADD-based (blue): 200–400 mW, 200–400 µm²
- MAC-based (red): 400–500 mW, 180–200 µm²
- **Trends**:
- MAC-based cores deviate from the red dashed line at higher power.
#### Graph 10: W_INT4A_FP8 (Repeated)
- **Power Range**: 0–250 mW
- **Area Range**: 0–100 µm²
- **Data Points**:
- LUT (green): 20–100 mW, 20–100 µm²
- ADD-based (blue): 100–250 mW, 100–200 µm²
- MAC-based (red): 200–250 mW, 90–100 µm²
- **Trends**:
- MAC-based cores show a plateau in area growth.
#### Graph 11: W_INT2A_FP16 (Repeated)
- **Power Range**: 0–250 mW
- **Area Range**: 0–200 µm²
- **Data Points**:
- LUT (green): 50–150 mW, 50–150 µm²
- ADD-based (blue): 150–250 mW, 150–200 µm²
- MAC-based (red): 200–250 mW, 180–200 µm²
- **Trends**:
- MAC-based cores exceed the red dashed line at 200 mW.
#### Graph 12: W_INT2A_FP8 (Repeated)
- **Power Range**: 0–120 mW
- **Area Range**: 0–50 µm²
- **Data Points**:
- LUT (green): 10–50 mW, 10–50 µm²
- ADD-based (blue): 50–120 mW, 50–50 µm²
- MAC-based (red): 100–120 mW, 40–50 µm²
- **Trends**:
- LUT cores maintain a linear efficiency curve.
- MAC-based cores cluster near the upper boundary.
### Key Observations
1. **LUT Tensor Cores** consistently demonstrate the lowest power-area trade-off across all configurations.
2. **MAC-based Tensor Cores** require significantly higher power and area, often clustering near the upper-right quadrant of the graphs.
3. **ADD-based Tensor Cores** fall between LUT and MAC-based cores in efficiency, with steeper power-area slopes.
4. **Dashed Lines** likely represent theoretical efficiency thresholds, with actual data points often exceeding these values.
5. **Configuration Variability**: Higher-precision configurations (e.g., FP16) generally require more power and area than lower-precision ones (e.g., FP8).
### Interpretation
The data suggests that **LUT Tensor Cores** are the most area-efficient, making them ideal for applications with strict power or area constraints. **MAC-based Tensor Cores**, while less efficient, may offer higher computational throughput, justifying their trade-offs in performance-critical scenarios. The **ADD-based Tensor Cores** represent a middle ground, balancing efficiency and performance.
The dashed lines imply that current implementations may not yet achieve theoretical optimal efficiency, highlighting opportunities for architectural improvements. Notably, MAC-based cores in high-power configurations (e.g., W_INT4A_FP16) deviate from their reference lines, suggesting potential inefficiencies at scale.
This analysis underscores the importance of selecting tensor core architectures based on application-specific requirements, balancing power, area, and performance trade-offs.
DECODING INTELLIGENCE...