\n
## Bar Chart: Prediction Flip Rate for Llama Models
### Overview
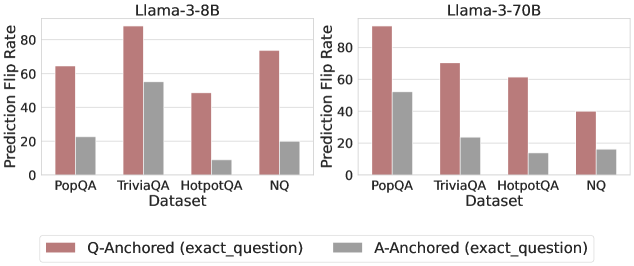
This image presents a comparative bar chart illustrating the Prediction Flip Rate for two Llama models (Llama-3-8B and Llama-3-70B) across four different datasets: PopQA, TriviaQA, HotpotQA, and NQ. The flip rate is measured on the Y-axis, while the datasets are displayed on the X-axis. Two types of anchoring are compared: Q-Anchored (based on the exact question) and A-Anchored (based on the exact answer).
### Components/Axes
* **X-axis:** "Dataset" with categories: PopQA, TriviaQA, HotpotQA, NQ.
* **Y-axis:** "Prediction Flip Rate" with a scale ranging from 0 to 60 (approximately).
* **Models:** Two separate charts are presented side-by-side, one for "Llama-3-8B" and one for "Llama-3-70B".
* **Legend:** Located at the bottom-center of the image.
* Red bars: "Q-Anchored (exact\_question)"
* Gray bars: "A-Anchored (exact\_question)"
### Detailed Analysis
**Llama-3-8B Chart:**
* **PopQA:** Q-Anchored: approximately 55. A-Anchored: approximately 25.
* **TriviaQA:** Q-Anchored: approximately 95. A-Anchored: approximately 50.
* **HotpotQA:** Q-Anchored: approximately 45. A-Anchored: approximately 10.
* **NQ:** Q-Anchored: approximately 60. A-Anchored: approximately 20.
**Llama-3-70B Chart:**
* **PopQA:** Q-Anchored: approximately 75. A-Anchored: approximately 50.
* **TriviaQA:** Q-Anchored: approximately 60. A-Anchored: approximately 25.
* **HotpotQA:** Q-Anchored: approximately 50. A-Anchored: approximately 20.
* **NQ:** Q-Anchored: approximately 40. A-Anchored: approximately 20.
**Trends:**
* In both models, the Q-Anchored bars are consistently higher than the A-Anchored bars across all datasets, indicating a higher prediction flip rate when anchoring on the question.
* For Llama-3-8B, the highest flip rate is observed for TriviaQA (Q-Anchored), and the lowest for HotpotQA (A-Anchored).
* For Llama-3-70B, the highest flip rate is observed for PopQA (Q-Anchored), and the lowest for HotpotQA (A-Anchored).
### Key Observations
* The Llama-3-70B model generally exhibits higher prediction flip rates than the Llama-3-8B model, particularly for the PopQA and TriviaQA datasets.
* The difference between Q-Anchored and A-Anchored flip rates is more pronounced for the Llama-3-8B model.
* HotpotQA consistently shows the lowest flip rates for both models and both anchoring methods.
### Interpretation
The data suggests that anchoring the prediction process on the question (Q-Anchored) leads to a higher rate of prediction flips compared to anchoring on the answer (A-Anchored). This could indicate that the models are more sensitive to variations in the question phrasing than variations in the answer. The larger flip rates for the Llama-3-70B model might suggest a greater capacity for nuanced understanding and sensitivity to input variations, but also potentially a higher susceptibility to being "flipped" by subtle changes. The consistently low flip rates for the HotpotQA dataset could indicate that this dataset is less ambiguous or more straightforward for the models to process, or that the models have learned to perform well on this specific dataset. The difference in flip rates between the two models could also be due to differences in their training data or model architecture. Further investigation would be needed to determine the underlying reasons for these observed patterns.