## Bar Chart: Prediction Flip Rate Comparison for Llama-3-8B and Llama-3-70B Models
### Overview
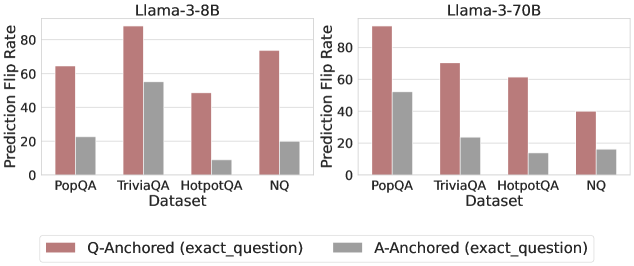
The image presents a grouped bar chart comparing prediction flip rates for two language models (Llama-3-8B and Llama-3-70B) across four question-answering datasets (PopQA, TriviaQA, HotpotQA, NQ). Two anchoring methods are compared: Q-Anchored (exact_question) and A-Anchored (exact_question), represented by red and gray bars respectively.
### Components/Axes
- **X-Axis**: Datasets (PopQA, TriviaQA, HotpotQA, NQ)
- **Y-Axis**: Prediction Flip Rate (%) ranging from 0 to 100
- **Legend**:
- Red: Q-Anchored (exact_question)
- Gray: A-Anchored (exact_question)
- **Model Labels**:
- Top-left: Llama-3-8B
- Top-right: Llama-3-70B
### Detailed Analysis
#### Llama-3-8B (Left Chart)
- **PopQA**:
- Q-Anchored: ~65% (red)
- A-Anchored: ~22% (gray)
- **TriviaQA**:
- Q-Anchored: ~88% (red)
- A-Anchored: ~55% (gray)
- **HotpotQA**:
- Q-Anchored: ~50% (red)
- A-Anchored: ~10% (gray)
- **NQ**:
- Q-Anchored: ~75% (red)
- A-Anchored: ~20% (gray)
#### Llama-3-70B (Right Chart)
- **PopQA**:
- Q-Anchored: ~90% (red)
- A-Anchored: ~50% (gray)
- **TriviaQA**:
- Q-Anchored: ~70% (red)
- A-Anchored: ~22% (gray)
- **HotpotQA**:
- Q-Anchored: ~60% (red)
- A-Anchored: ~12% (gray)
- **NQ**:
- Q-Anchored: ~40% (red)
- A-Anchored: ~15% (gray)
### Key Observations
1. **Q-Anchored Consistently Outperforms A-Anchored**:
- Across all datasets and models, Q-Anchored (red) bars are significantly taller than A-Anchored (gray) bars.
- Example: In Llama-3-8B TriviaQA, Q-Anchored reaches ~88% vs. A-Anchored at ~55%.
2. **Model Size Impact**:
- Llama-3-70B generally shows higher absolute flip rates than Llama-3-8B, particularly in PopQA (90% vs. 65% for Q-Anchored).
3. **Dataset-Specific Trends**:
- **TriviaQA** has the highest Q-Anchored flip rates for both models.
- **NQ** shows the lowest A-Anchored performance in Llama-3-70B (~15%).
4. **Anchoring Method Effect**:
- Q-Anchored (exact_question) correlates with higher flip rates, suggesting stronger question-specific performance.
- A-Anchored (exact_question) underperforms, with rates often below 30% except in Llama-3-70B PopQA (~50%).
### Interpretation
The data demonstrates that **Q-Anchored (exact_question)** anchoring significantly improves prediction flip rates compared to A-Anchored (exact_question) across all datasets and model sizes. This suggests that question-specific anchoring enhances model performance in QA tasks. The Llama-3-70B model achieves higher absolute rates than Llama-3-8B, indicating that larger model size amplifies the benefits of Q-Anchored methods. Notably, the A-Anchored method struggles in NQ for Llama-3-70B, highlighting potential limitations in answer-based anchoring for complex datasets. The consistent trend across models implies that anchoring strategy matters more than model size for flip rate optimization.