## Heatmap: Binary Matrix Representation
### Overview
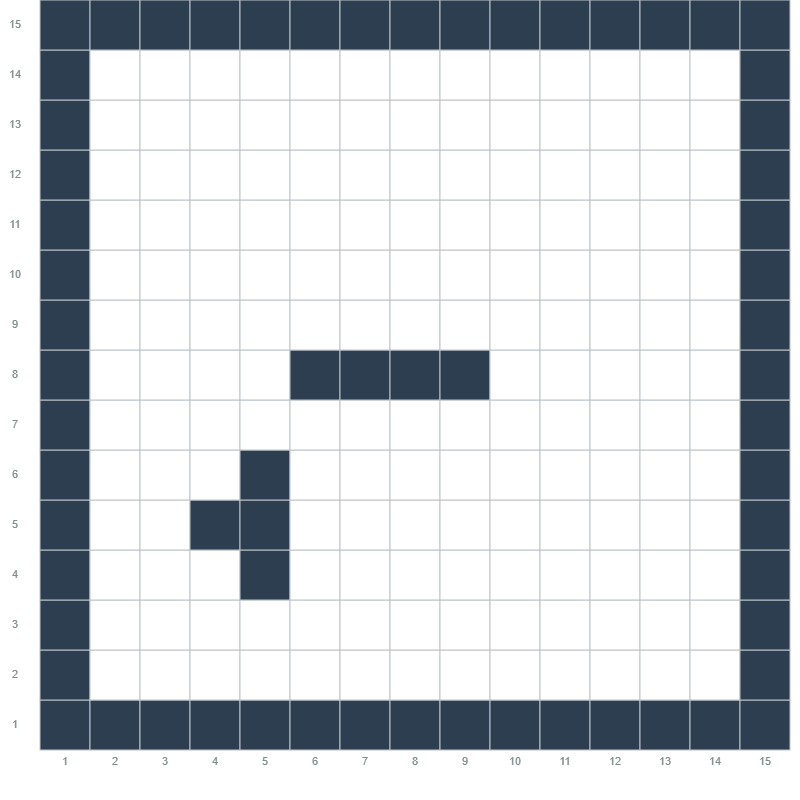
The image depicts a 15x15 grid with specific cells filled in dark blue. The grid has labeled axes (1–15) on both the vertical (rows) and horizontal (columns). No explicit title, legend, or textual annotations are present. The filled cells form a structured pattern, suggesting a binary or categorical representation.
### Components/Axes
- **Axes**:
- **X-axis (columns)**: Labeled 1–15 at the bottom.
- **Y-axis (rows)**: Labeled 1–15 on the left.
- **Grid Structure**:
- 15 rows and 15 columns, creating 225 cells.
- Cells are either empty (white) or filled (dark blue).
### Detailed Analysis
- **Filled Cells**:
- **Border**: All cells in row 1, row 15, column 1, and column 15 are filled.
- **Internal Blocks**:
- A 5-cell horizontal block in row 8, columns 5–9.
- A 2x2 block in rows 5–6, columns 4–5.
- **Other Filled Cells**:
- Row 6, column 6.
- Row 7, column 5.
- Row 9, column 5.
- **Empty Cells**:
- All non-border cells outside the described blocks are empty.
### Key Observations
1. **Symmetry**: The border forms a complete frame, creating a "box" around the grid.
2. **Internal Patterns**:
- The 5-cell block in row 8 (columns 5–9) is the longest contiguous horizontal segment.
- The 2x2 block in rows 5–6, columns 4–5, is the only vertical cluster outside the border.
3. **Sparse Distribution**: Most cells are empty, with filled cells concentrated in specific regions.
### Interpretation
This grid likely represents a binary matrix or a heatmap encoding categorical data (e.g., presence/absence, on/off states). The absence of labels or legends prevents direct interpretation of the data’s meaning. However, the structured placement of filled cells suggests:
- **Possible Encoding**: A puzzle (e.g., Sudoku variant), a binary image, or a sparse matrix for computational purposes.
- **Anomalies**: The 2x2 block in rows 5–6, columns 4–5, breaks the otherwise linear patterns, potentially indicating a deliberate design choice or error.
- **Functionality**: The border may serve as a boundary condition, while internal blocks could represent specific features or constraints.
### Limitations
No textual or numerical data is present to confirm the purpose or context of the grid. The interpretation relies solely on the spatial distribution of filled cells.