\n
## Chart: Age-Related Infection and Seroprevalence
### Overview
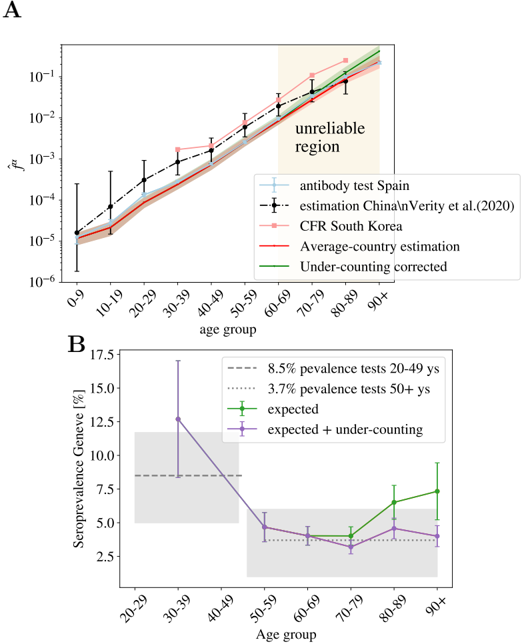
The image presents two charts (labeled A and B) depicting the relationship between age and infection risk (Chart A) and age and seroprevalence (Chart B). Chart A shows the risk (R) of infection across different age groups, comparing data from antibody tests in Spain with estimations from China/Verity et al. (2020) and South Korea, alongside average country estimations and under-counting corrected data. Chart B displays the seroprevalence in Geneva, Switzerland, comparing expected values with those adjusted for under-counting, also across age groups.
### Components/Axes
**Chart A:**
* **X-axis:** Age group (0-9, 10-19, 20-29, 30-39, 40-49, 50-59, 60-69, 70-79, 80-89, 90+)
* **Y-axis:** Risk (R), on a logarithmic scale (10^-6 to 10^-1)
* **Legend:**
* Light Blue: antibody test Spain (with error bars)
* Black Dashed: estimation China/Verity et al.(2020) CFR South Korea (with error bars)
* Dark Red: Average-country estimation
* Orange: Under-counting corrected
* **Annotation:** "unreliable region" - a shaded yellow area in the top-right corner of the chart.
**Chart B:**
* **X-axis:** Age group (20-29, 30-39, 40-49, 50-59, 60-69, 70-79, 80-89, 90+)
* **Y-axis:** Seroprevalence Geneva [%] (2.5% to 17.5%)
* **Legend:**
* Purple: expected
* Pink: expected + under-counting
* **Annotations:**
* "8.5% pevalence tests 20-49 ys"
* "3.7% pevalence tests 50+ ys"
### Detailed Analysis or Content Details
**Chart A:**
* **Spain Antibody Test (Light Blue):** The line starts at approximately 2 x 10^-6 for the 0-9 age group, rises to around 3 x 10^-5 for 10-19, plateaus around 5 x 10^-5 for 20-49, then increases sharply to approximately 2 x 10^-4 for 60-69, and continues to rise to approximately 8 x 10^-4 for 90+. Error bars are present for each age group, indicating variability.
* **China/South Korea Estimation (Black Dashed):** The line begins at approximately 1 x 10^-5 for 0-9, increases to around 2 x 10^-5 for 10-19, then rises sharply to approximately 5 x 10^-4 for 40-49, and continues to increase to approximately 1 x 10^-3 for 90+. Error bars are present.
* **Average-Country Estimation (Dark Red):** The line starts at approximately 1 x 10^-6 for 0-9, rises steadily to approximately 3 x 10^-5 for 20-29, then increases more rapidly to approximately 2 x 10^-4 for 60-69, and continues to rise to approximately 7 x 10^-4 for 90+.
* **Under-counting Corrected (Orange):** The line starts at approximately 1 x 10^-6 for 0-9, rises to approximately 2 x 10^-5 for 10-19, then increases to approximately 4 x 10^-5 for 30-39, and continues to rise to approximately 8 x 10^-4 for 90+.
**Chart B:**
* **Expected (Purple):** The line starts at approximately 15% for 20-29, drops sharply to approximately 5% for 30-39, then decreases gradually to approximately 3% for 60-69, and remains relatively stable at around 3-4% for 70-79, 80-89, and 90+. Error bars are present.
* **Expected + Under-counting (Pink):** The line starts at approximately 12% for 20-29, drops to approximately 4% for 30-39, then decreases gradually to approximately 2.5% for 60-69, and remains relatively stable at around 2.5-3.5% for 70-79, 80-89, and 90+. Error bars are present.
### Key Observations
* **Chart A:** Infection risk generally increases with age, particularly after the 50-59 age group. The China/South Korea estimation consistently shows higher risk compared to the Spain antibody test data. The "unreliable region" suggests that the data may be less accurate for older age groups.
* **Chart B:** Seroprevalence in Geneva decreases with age, with a significant drop between the 20-29 and 30-39 age groups. Adjusting for under-counting lowers the estimated seroprevalence across all age groups.
### Interpretation
Chart A suggests that older individuals are at a higher risk of infection, which aligns with general epidemiological understanding of immune system decline with age. The differences between the data sources (Spain, China/South Korea) could be due to variations in testing strategies, reporting practices, or the prevalence of different viral strains. The "unreliable region" highlights the challenges of accurately assessing infection risk in older populations.
Chart B indicates that younger adults (20-29) in Geneva have a higher seroprevalence, suggesting a greater exposure to the virus in this age group. The decline in seroprevalence with age could be due to a combination of factors, including reduced social mixing, increased caution, or a lower likelihood of developing symptomatic infection. The adjustment for under-counting suggests that the true seroprevalence may be higher than initially estimated, particularly in older age groups.
The two charts together provide a comprehensive picture of the age-related dynamics of infection and immunity. They highlight the importance of targeted public health interventions to protect vulnerable populations and to accurately monitor the spread of the virus. The discrepancies between the data sources underscore the need for standardized data collection and reporting practices.