## Heatmap: Correlation matrix of mean accuracy across datasets
### Overview
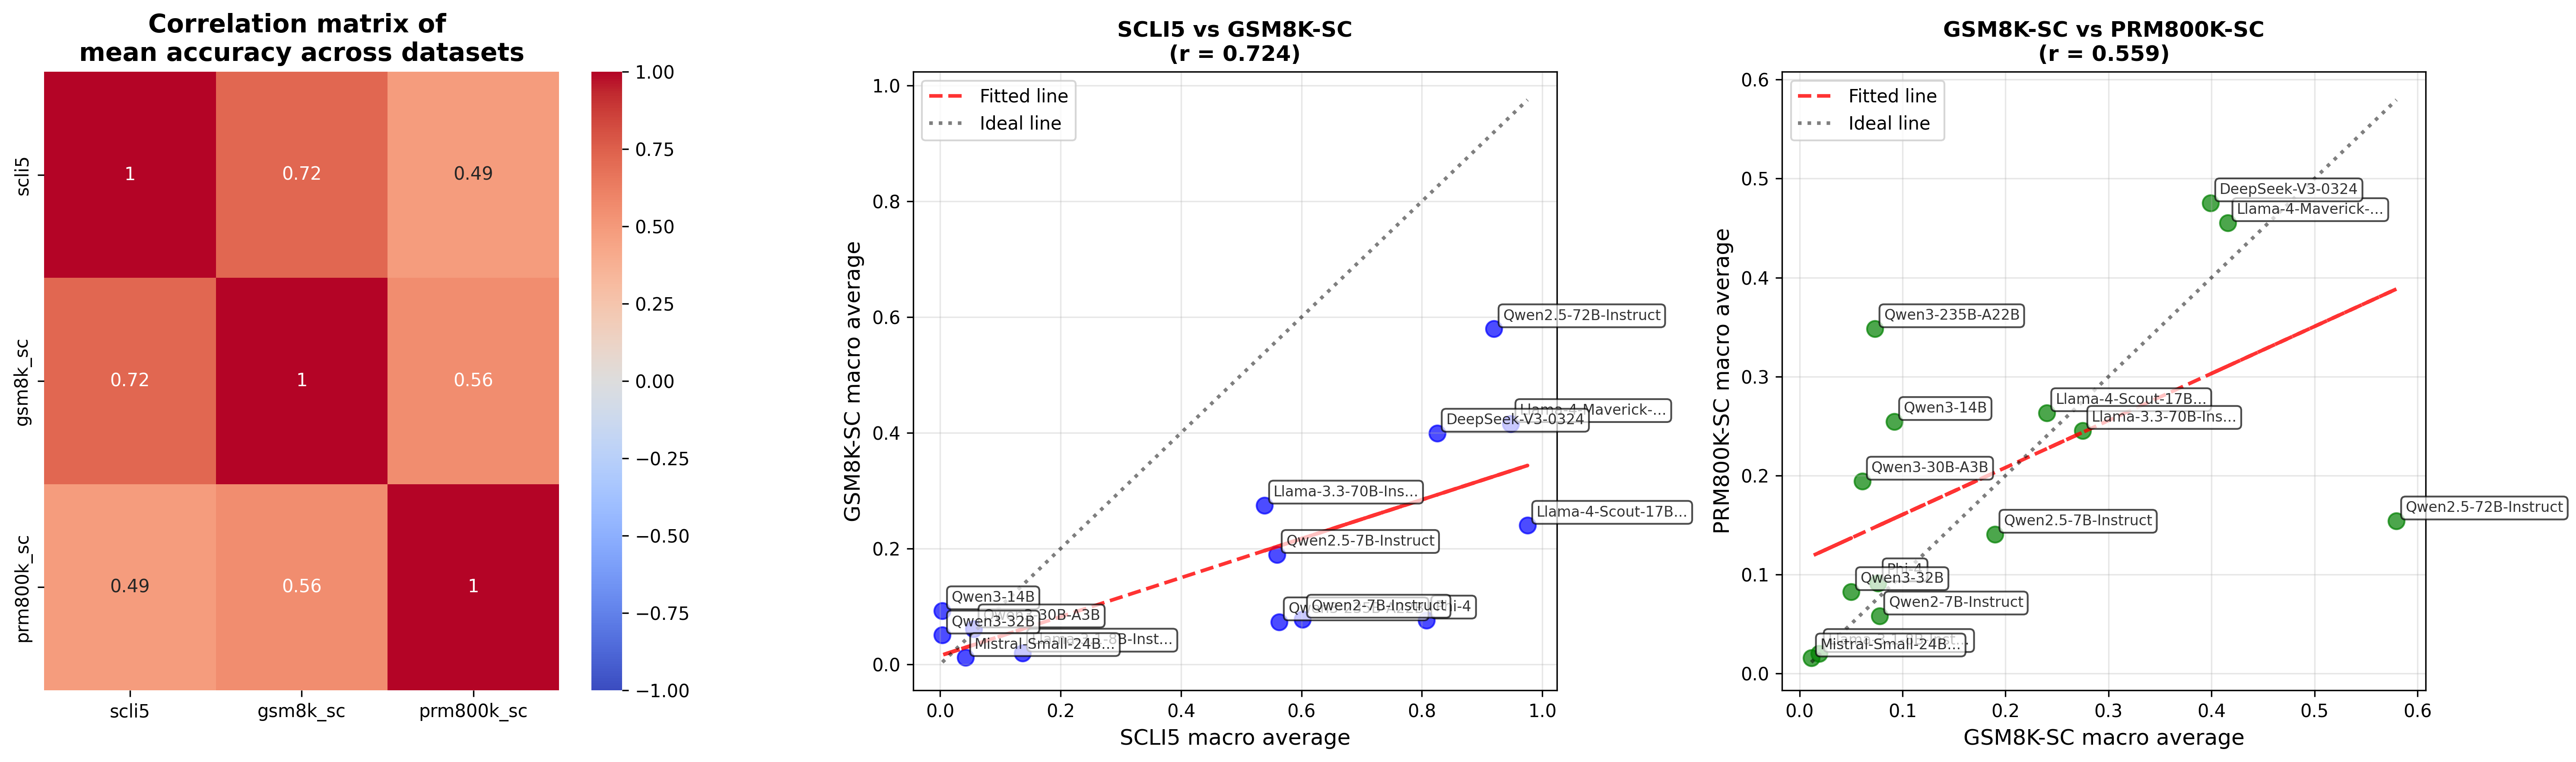
A 3x3 correlation matrix visualizing relationships between three datasets: scli5, gsm8k_sc, and prm800k_sc. Values range from -1 to 1, with darker red indicating stronger positive correlation.
### Components/Axes
- **Rows/Columns**:
- Top row: scli5
- Middle row: gsm8k_sc
- Bottom row: prm800k_sc
- **Color Scale**:
- Blue (-1.0) to Red (+1.0)
- White (0.0) as midpoint
- **Values**:
- Diagonal: All 1.0 (perfect self-correlation)
- Off-diagonal:
- scli5-gsm8k_sc: 0.72
- scli5-prm800k_sc: 0.49
- gsm8k_sc-prm800k_sc: 0.56
### Detailed Analysis
- **scli5**:
- Strongest correlation with gsm8k_sc (0.72)
- Moderate correlation with prm800k_sc (0.49)
- **gsm8k_sc**:
- Moderate correlation with prm800k_sc (0.56)
- **prm800k_sc**:
- Weakest overall correlation (0.49 with scli5)
### Key Observations
- All datasets show positive correlations
- scli5 and gsm8k_sc share the strongest relationship
- prm800k_sc demonstrates weaker but still positive relationships
### Interpretation
The matrix reveals that scli5 and gsm8k_sc are most closely related in terms of mean accuracy performance across datasets. prm800k_sc shows more divergent behavior, suggesting different underlying characteristics or performance patterns compared to the other two datasets.
---
## Scatter Plot: SCLI5 vs GSM8K-SC (r = 0.724)
### Overview
Scatter plot comparing SCLI5 and GSM8K-SC macro averages with fitted and ideal trend lines. Points labeled with model names.
### Components/Axes
- **X-axis**: SCLI5 macro average (0.0-1.0)
- **Y-axis**: GSM8K-SC macro average (0.0-1.0)
- **Legend**:
- Dashed red: Fitted line
- Dotted gray: Ideal line (y=x)
### Detailed Analysis
- **Trend**:
- Fitted line (r=0.724) shows strong positive correlation
- Points generally cluster near the ideal line
- **Data Points**:
- **Bottom-left cluster** (0.0-0.2 SCLI5, 0.0-0.2 GSM8K):
- Mistral-Small-24B-Instruct-v1.0
- Qwen3-32B
- Qwen3-30B-A3B
- **Middle cluster** (0.3-0.6 SCLI5, 0.2-0.4 GSM8K):
- Qwen2.5-7B-Instruct
- Qwen2.5-7B-Instruct-i4
- Qwen3-14B
- **Top-right cluster** (0.7-1.0 SCLI5, 0.4-0.8 GSM8K):
- Qwen2.5-72B-Instruct
- DeepSeek-V3-0324
- Llama-3-70B-Instruct-v1.0
### Key Observations
- High-performing models (top-right) show strong alignment between SCLI5 and GSM8K-SC
- Lower-performing models cluster in the bottom-left
- Fitted line closely follows the ideal line, indicating linear relationship
### Interpretation
The strong correlation (r=0.724) suggests that performance on SCLI5 strongly predicts performance on GSM8K-SC. The clustering of models indicates distinct performance tiers, with high-performing models showing consistent excellence across both benchmarks.
---
## Scatter Plot: GSM8K-SC vs PRM800K-SC (r = 0.559)
### Overview
Scatter plot comparing GSM8K-SC and PRM800K-SC macro averages with fitted and ideal trend lines. Points labeled with model names.
### Components/Axes
- **X-axis**: GSM8K-SC macro average (0.0-0.6)
- **Y-axis**: PRM800K-SC macro average (0.0-0.6)
- **Legend**:
- Dashed red: Fitted line
- Dotted gray: Ideal line (y=x)
### Detailed Analysis
- **Trend**:
- Fitted line (r=0.559) shows moderate positive correlation
- Points show more dispersion than previous plot
- **Data Points**:
- **Bottom-left cluster** (0.0-0.2 GSM8K, 0.0-0.2 PRM800K):
- Mistral-Small-24B-Instruct-v1.0
- Qwen3-32B
- Qwen2.5-7B-Instruct
- **Middle cluster** (0.2-0.4 GSM8K, 0.1-0.3 PRM800K):
- Qwen3-14B
- Llama-3-70B-Instruct-v1.0
- **Top-right cluster** (0.4-0.6 GSM8K, 0.3-0.6 PRM800K):
- DeepSeek-V3-0324
- Llama-4-Maverick-17B-Instruct
- Qwen2.5-72B-Instruct
### Key Observations
- Weaker correlation (r=0.559) compared to SCLI5-GSM8K relationship
- More dispersed data points indicate less consistent relationships
- High-performing models show better alignment with the fitted line
### Interpretation
The moderate correlation suggests that while there's some relationship between GSM8K-SC and PRM800K-SC performance, it's less consistent than the SCLI5-GSM8K relationship. The dispersion of points indicates that models may perform differently across these benchmarks, suggesting varying strengths in different reasoning domains.
---
## Cross-Plot Analysis
1. **Consistency**:
- SCLI5-GSM8K shows strongest correlation (r=0.724)
- GSM8K-PRM800K shows weakest correlation (r=0.559)
2. **Model Performance**:
- Qwen2.5-72B-Instruct consistently performs best across all benchmarks
- Mistral-Small-24B-Instruct-v1.0 consistently performs worst
3. **Trend Lines**:
- Fitted lines in both scatter plots closely follow ideal lines, suggesting linear relationships
- steeper slope in SCLI5-GSM8K plot indicates stronger relationship
## Conclusion
The correlation matrix and scatter plots reveal distinct performance patterns across different reasoning benchmarks. The strong SCLI5-GSM8K relationship suggests shared characteristics in these benchmarks, while the weaker GSM8K-PRM800K relationship indicates more divergent performance characteristics. Model performance tiers are clearly distinguishable, with high-performing models showing consistent excellence across all benchmarks.