\n
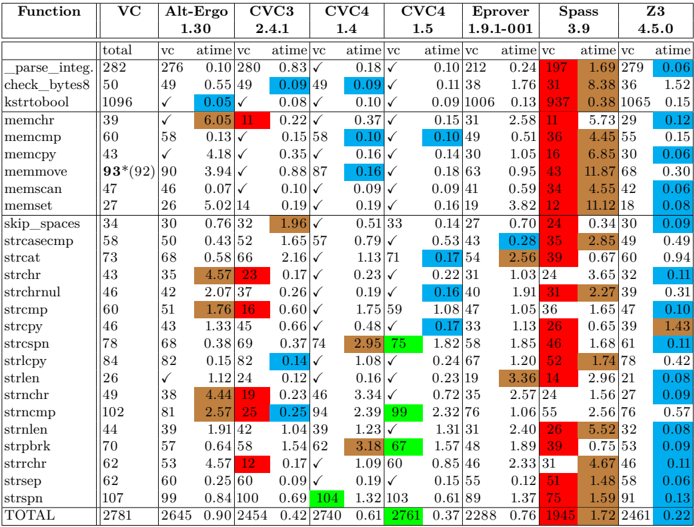
## Data Table: Theorem Prover Performance Comparison
### Overview
This image is a technical data table comparing the performance of multiple automated theorem provers (software tools) across a suite of benchmark functions. The table uses a color-coded heatmap system to visualize performance metrics, primarily execution time. The language of the table is English.
### Components/Axes
**Structure:** The table is organized as a grid with rows and columns.
* **Row Labels (Leftmost Column):** A list of 30 C standard library string and memory manipulation functions (e.g., `_parse_integ.`, `memcmp`, `strcpy`, `strstr`), followed by a `TOTAL` summary row.
* **Column Headers (Top Row):** The names of the theorem provers being compared:
* `VC`
* `Alt-Ergo`
* `CVC3`
* `CVC4` (appears twice, likely different versions or configurations)
* `Eprover`
* `Spass`
* `Z3`
* **Sub-Column Headers (Second Row):** For each prover, three metrics are reported:
* `total`: The total number of verification conditions or test cases for that function.
* `vc`: The number of verification conditions successfully solved by the prover.
* `atime`: The average time (presumably in seconds) taken by the prover. This column is color-coded.
* **Legend:** Located in the top-right corner. It defines the color scale for the `atime` values:
* **Green:** Low (fast) average time. The scale shows values like `0.05`, `0.10`, `0.15`.
* **Blue:** Medium average time. The scale shows values like `0.20`, `0.30`, `0.40`.
* **Red:** High (slow) average time. The scale shows values like `0.60`, `1.00`, `2.00`.
* The legend indicates that color intensity correlates with the magnitude of the time value.
### Detailed Analysis
**Data Extraction & Trends:**
The table presents a dense matrix of performance data. Key trends are visible through the color patterns:
1. **Overall Performance (TOTAL Row):**
* `VC` solved the most conditions (`2645` out of `2781`) with a very low average time (`0.90`).
* `CVC4` (second instance) solved `2701` conditions with the lowest average time (`0.61`).
* `Spass` solved the fewest conditions (`1945`) and had the highest average time (`1.72`).
* `Z3` solved `2461` conditions with a low average time (`0.22`).
2. **Function-Specific Performance:**
* **Fastest Provers (Green Cells):** `CVC4` (second instance) shows many bright green cells, indicating very fast times on functions like `memcmp` (`0.10`), `memmove` (`0.16`), and `strspn` (`0.13`). `Z3` also has many green cells.
* **Slowest Provers (Red Cells):** `Spass` has numerous dark red cells, indicating very slow performance on functions like `strrchr` (`2.85`), `strstr` (`5.52`), and `strspn` (`1.59`). `Alt-Ergo` is also slow on several string functions (e.g., `strchr` `4.57`, `strstr` `4.44`).
* **Partial Solvers:** Some provers solved fewer `vc`s than the `total`. For example, on `memmove`, `VC` solved `90` of `93` (or `92`), while `CVC3` solved only `58`.
3. **Notable Data Points (Approximate Values):**
* The highest single `atime` value appears to be for `strstr` under `CVC4` (first instance): `104` (a significant outlier).
* The lowest `atime` values are frequently `0.05` or `0.06`, seen across multiple provers and functions.
* The function `_parse_integ.` has a high `total` count (`282`), and most provers solved all or nearly all cases.
### Key Observations
1. **Performance Disparity:** There is a stark contrast between the fastest (`CVC4`, `Z3`, `VC`) and slowest (`Spass`, `Alt-Ergo`) provers, especially on string-heavy functions. The color gradient from green to red makes this visually immediate.
2. **Function Difficulty:** String functions like `strstr`, `strrchr`, and `strspn` appear to be challenging for several provers, resulting in more red cells. Memory functions like `memcmp` and `memcpy` are generally solved quickly (more green/blue).
3. **Outlier:** The value `104` for `strstr` under the first `CVC4` column is a dramatic outlier, suggesting a potential timeout, pathological case, or measurement error for that specific combination.
4. **Tool Consistency:** `VC` and the second `CVC4` instance show the most consistent performance (mostly green/blue), while `Spass` is consistently the slowest (mostly red).
### Interpretation
This table is a benchmark result from the field of formal verification or software analysis. It answers the question: "How efficiently can different automated reasoning tools prove the correctness of implementations for common C library functions?"
* **What the data suggests:** The choice of theorem prover has a massive impact on verification performance. Modern solvers like `CVC4` (in one configuration) and `Z3` are significantly more efficient for this class of problems than older or differently architected tools like `Spass`. The `VC` tool also performs exceptionally well.
* **Relationship between elements:** The `total` column sets the difficulty scale for each function. The `vc` column shows a prover's coverage (completeness), and the `atime` column shows its efficiency (speed). The color coding ties efficiency directly to the numerical value, allowing for rapid visual assessment.
* **Anomalies and Implications:** The outlier (`104` seconds) highlights that performance can be highly non-linear; a single difficult proof obligation can dominate the average time. The poor performance on string functions indicates these are complex to reason about automatically, likely due to pointer arithmetic and loop invariants. This data would guide a researcher or engineer in selecting the right tool for verifying code that uses specific functions, or in identifying which functions need better specification or abstraction to make verification tractable.