# Technical Diagram Analysis
## Diagram Type
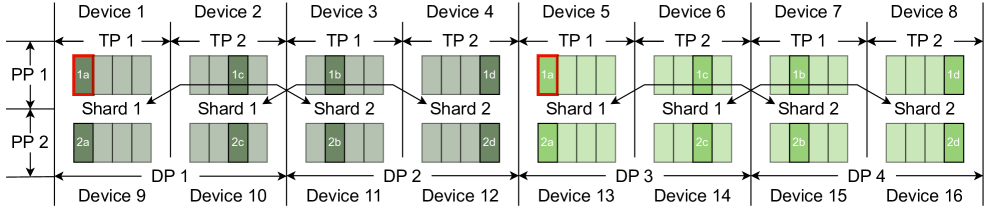
This is a **network architecture diagram** illustrating data flow between devices, transmission points (TPs), shards, and data points (DPs).
---
## Key Components and Flow
### 1. **Devices (1–8)**
- **Devices 1–8** are arranged in two rows:
- **Top Row**: Devices 1–4 connected to **TP1** and **TP2**.
- **Bottom Row**: Devices 5–8 connected to **TP1** and **TP2**.
- **Connections**:
- Each device is linked to a TP via bidirectional arrows (data flow).
- Example: Device 1 → TP1 → Shard 1 → DP1 → Device 9.
### 2. **Transmission Points (TPs)**
- **TP1** and **TP2** are central nodes:
- **TP1** connects to Devices 1, 3, 5, 7.
- **TP2** connects to Devices 2, 4, 6, 8.
- **Shards**:
- Each TP has **two shards** (Shard 1 and Shard 2).
- Shards are color-coded:
- **Red**: Shard 1 (e.g., 1a, 1b, 1c, 1d).
- **Green**: Shard 2 (e.g., 2a, 2b, 2c, 2d).
### 3. **Data Points (DPs)**
- **DP1–DP4** are at the bottom:
- **DP1** connects to Devices 9 and 10.
- **DP2** connects to Devices 11 and 12.
- **DP3** connects to Devices 13 and 14.
- **DP4** connects to Devices 15 and 16.
- **Flow**:
- Data flows from TPs → Shards → DPs → Devices 9–16.
---
## Legend and Color Coding
- **Legend Location**: Bottom-left corner of the diagram.
- **Color Assignments**:
- **Red**: Shard 1 (e.g., 1a, 1b, 1c, 1d).
- **Green**: Shard 2 (e.g., 2a, 2b, 2c, 2d).
- **Gray**: Data points (e.g., 1a, 1b, 2a, 2b).
- **Validation**: All shard labels match their respective colors in the legend.
---
## Spatial Grounding
- **Legend Position**: Bottom-left (coordinates: [x=0, y=0] relative to diagram).
- **Device Arrangement**:
- Devices 1–8: Top row (left to right).
- Devices 9–16: Bottom row (left to right).
- **TP/Shard Placement**:
- TPs are centrally located between device rows.
- Shards are directly below TPs.
---
## Data Flow Paths
1. **Device 1 → TP1 → Shard 1 (1a) → DP1 → Device 9**.
2. **Device 2 → TP2 → Shard 1 (1c) → DP2 → Device 11**.
3. **Device 3 → TP1 → Shard 2 (1b) → DP3 → Device 13**.
4. **Device 4 → TP2 → Shard 2 (1d) → DP4 → Device 15**.
5. **Device 5 → TP1 → Shard 1 (2a) → DP1 → Device 10**.
6. **Device 6 → TP2 → Shard 1 (2c) → DP2 → Device 12**.
7. **Device 7 → TP1 → Shard 2 (2b) → DP3 → Device 14**.
8. **Device 8 → TP2 → Shard 2 (2d) → DP4 → Device 16**.
---
## Observations
- **Redundancy**: Each DP is connected to two devices (e.g., DP1 → Devices 9 and 10).
- **Symmetry**: Devices 1–4 and 5–8 mirror connections to TPs and shards.
- **Color Consistency**: Shard labels (1a–2d) align with their legend colors (red/green).
---
## Notes
- No numerical data or trends are present; the diagram focuses on structural relationships.
- All text is in **English**; no other languages are detected.