## Line Graphs: Success Rate vs. δ = n/d and Final Correlation vs. δ = n/d
### Overview
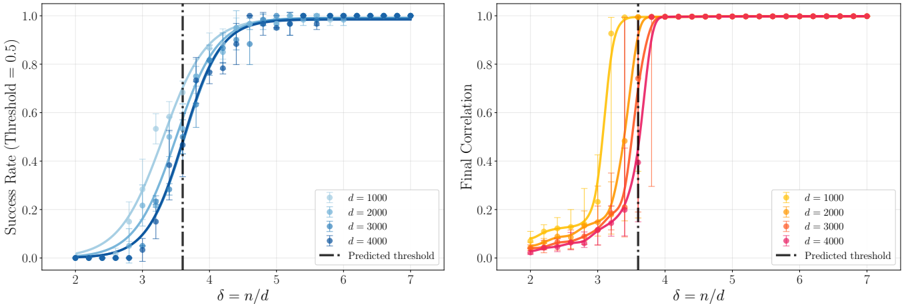
The image contains two side-by-side line graphs. The left graph plots "Success Rate (Threshold = 0.5)" against δ = n/d, while the right graph plots "Final Correlation" against the same δ = n/d. Both graphs include multiple data series (d = 1000, 2000, 3000, 4000) and a predicted threshold line at δ = 4. Error bars indicate variability in measurements.
---
### Components/Axes
- **Left Graph**:
- **Y-axis**: Success Rate (Threshold = 0.5), scaled from 0.0 to 1.0.
- **X-axis**: δ = n/d, scaled from 2 to 7.
- **Legend**:
- Light blue: d = 1000
- Medium blue: d = 2000
- Dark blue: d = 3000
- Very dark blue: d = 4000
- **Predicted Threshold**: Dashed vertical line at δ = 4.
- **Right Graph**:
- **Y-axis**: Final Correlation, scaled from 0.0 to 1.0.
- **X-axis**: δ = n/d, scaled from 2 to 7.
- **Legend**:
- Yellow: d = 1000
- Orange: d = 2000
- Red: d = 3000
- Pink: d = 4000
- **Predicted Threshold**: Dashed vertical line at δ = 4.
---
### Detailed Analysis
#### Left Graph (Success Rate)
- **Trends**:
- All data series show a sigmoidal increase in success rate as δ increases.
- Lower d values (e.g., d = 1000) exhibit gradual curves with slower convergence to 1.0.
- Higher d values (e.g., d = 4000) show steeper rises, reaching near 1.0 by δ ≈ 5.
- Error bars decrease in size as δ approaches 7, indicating reduced variability at higher δ.
- **Key Data Points**:
- At δ = 3: Success rates range from ~0.3 (d = 1000) to ~0.5 (d = 4000).
- At δ = 5: Success rates exceed 0.9 for all d values.
- Predicted threshold at δ = 4 aligns with the inflection point where success rates cross 0.5.
#### Right Graph (Final Correlation)
- **Trends**:
- All data series peak sharply near δ = 4, then decline steeply.
- Higher d values (e.g., d = 4000) achieve higher peak correlations (~0.95) but drop more abruptly post-δ = 4.
- Lower d values (e.g., d = 1000) have lower peaks (~0.8) and gentler declines.
- Error bars are largest near δ = 4, reflecting high variability at the threshold.
- **Key Data Points**:
- At δ = 3: Correlations range from ~0.2 (d = 1000) to ~0.5 (d = 4000).
- At δ = 5: Correlations drop to ~0.1 (d = 1000) and ~0.3 (d = 4000).
- Predicted threshold at δ = 4 coincides with the peak of all curves.
---
### Key Observations
1. **Threshold Behavior**: The predicted threshold at δ = 4 marks a critical transition point. Success rates and correlations peak here, after which performance declines.
2. **d-Dependent Performance**:
- Larger d values (4000) achieve higher success rates and correlations but are more sensitive to δ > 4.
- Smaller d values (1000) show slower convergence and lower peak performance.
3. **Error Patterns**: Variability increases near δ = 4, suggesting uncertainty in measurements at the threshold.
---
### Interpretation
The data demonstrates that δ = n/d acts as a critical parameter influencing system performance. The predicted threshold at δ = 4 likely represents an optimal balance between resource allocation (n/d) and performance. Higher d values improve robustness and peak performance but amplify sensitivity to deviations beyond δ = 4. This suggests that system design should prioritize maintaining δ ≤ 4 while maximizing d to enhance reliability. The error bars highlight the need for larger sample sizes (d) to reduce uncertainty, particularly near the threshold.