## Scatter Plot: Accuracy vs. Deep-Thinking Ratio for Different Thresholds
### Overview
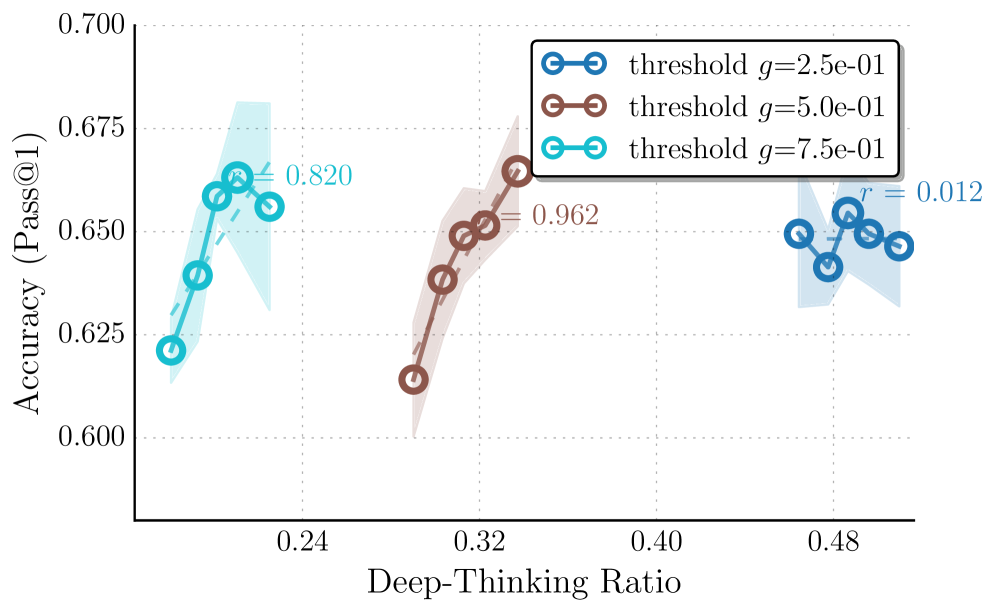
The image is a scatter plot showing the relationship between "Accuracy (Pass@1)" and "Deep-Thinking Ratio" for three different threshold values (g=2.5e-01, g=5.0e-01, and g=7.5e-01). Each threshold has a corresponding data series plotted with a specific color and marker. The plot also includes shaded regions around each data series, presumably indicating a confidence interval or standard deviation.
### Components/Axes
* **X-axis:** Deep-Thinking Ratio, with tick marks at approximately 0.24, 0.32, 0.40, and 0.48.
* **Y-axis:** Accuracy (Pass@1), with tick marks at 0.600, 0.625, 0.650, 0.675, and 0.700.
* **Legend (Top-Right):**
* Blue: threshold g=2.5e-01
* Brown: threshold g=5.0e-01
* Teal: threshold g=7.5e-01
### Detailed Analysis
* **Threshold g=2.5e-01 (Blue):**
* Trend: Relatively flat, with a slight decrease in accuracy as the Deep-Thinking Ratio increases.
* Data Points: The Deep-Thinking Ratio values are clustered around 0.48. The accuracy values range from approximately 0.64 to 0.65.
* Additional Note: "r = 0.012" is displayed near this data series.
* **Threshold g=5.0e-01 (Brown):**
* Trend: Line slopes upward. Accuracy increases as the Deep-Thinking Ratio increases.
* Data Points: The Deep-Thinking Ratio values range from approximately 0.28 to 0.34. The accuracy values range from approximately 0.61 to 0.66.
* Additional Note: "0.962" is displayed near the top of this data series.
* **Threshold g=7.5e-01 (Teal):**
* Trend: Line slopes upward initially, then decreases. Accuracy increases initially as the Deep-Thinking Ratio increases, then decreases.
* Data Points: The Deep-Thinking Ratio values range from approximately 0.18 to 0.24. The accuracy values range from approximately 0.62 to 0.66.
* Additional Note: "0.820" is displayed near the top of this data series.
### Key Observations
* The brown data series (threshold g=5.0e-01) shows a clear positive correlation between Deep-Thinking Ratio and Accuracy.
* The teal data series (threshold g=7.5e-01) has a peak in accuracy around a Deep-Thinking Ratio of 0.22.
* The blue data series (threshold g=2.5e-01) has a relatively constant accuracy across the Deep-Thinking Ratio values.
### Interpretation
The plot suggests that the optimal Deep-Thinking Ratio for maximizing accuracy depends on the threshold value (g). A threshold of g=5.0e-01 appears to benefit from a higher Deep-Thinking Ratio, while a threshold of g=7.5e-01 has an optimal Deep-Thinking Ratio around 0.22. The threshold of g=2.5e-01 seems relatively insensitive to changes in the Deep-Thinking Ratio within the observed range. The values "r = 0.012", "0.962", and "0.820" are likely correlation coefficients or R-squared values, indicating the strength of the relationship between the two variables for each threshold. The shaded regions represent the uncertainty or variability in the accuracy for each Deep-Thinking Ratio and threshold.