## Chart: Accuracy vs. Deep-Thinking Ratio
### Overview
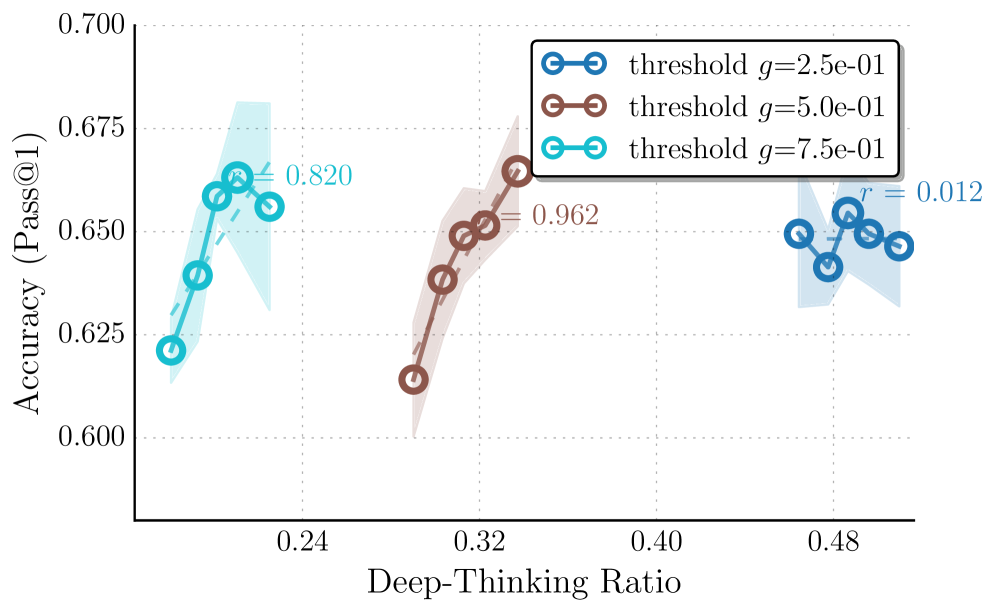
The image presents a line chart illustrating the relationship between "Deep-Thinking Ratio" and "Accuracy (Pass@1)". Three different lines are plotted, each representing a different "threshold" value (g). The chart also includes shaded regions around each line, likely representing a confidence interval or standard deviation.
### Components/Axes
* **X-axis:** "Deep-Thinking Ratio" ranging from approximately 0.20 to 0.50. Markers are present at 0.24, 0.32, and 0.48.
* **Y-axis:** "Accuracy (Pass@1)" ranging from approximately 0.60 to 0.70. Markers are present at 0.60, 0.625, 0.65, 0.675, and 0.70.
* **Legend:** Located in the top-right corner, it identifies three lines:
* Blue line with circle markers: "threshold g=2.5e-01"
* Gray line with circle markers: "threshold g=5.0e-01"
* Teal line with circle markers: "threshold g=7.5e-01"
* **Annotations:** Two annotations are present on the chart:
* "0.820" near the blue line at approximately Deep-Thinking Ratio = 0.24
* "0.962" near the gray line at approximately Deep-Thinking Ratio = 0.32
* "r = 0.012" near the teal line at approximately Deep-Thinking Ratio = 0.48
### Detailed Analysis
Let's analyze each line individually:
* **Blue Line (g=2.5e-01):** This line shows an initial upward slope from a Deep-Thinking Ratio of approximately 0.20 to 0.24, reaching an accuracy of around 0.625 to 0.675. After 0.24, the line plateaus and fluctuates around 0.67. Data points (approximate):
* (0.20, 0.62)
* (0.24, 0.67)
* (0.32, 0.67)
* (0.40, 0.67)
* (0.48, 0.67)
* **Gray Line (g=5.0e-01):** This line exhibits a more pronounced upward trend from a Deep-Thinking Ratio of approximately 0.20 to 0.32, increasing from an accuracy of around 0.62 to 0.675. After 0.32, the line declines slightly and fluctuates around 0.65. Data points (approximate):
* (0.20, 0.62)
* (0.24, 0.64)
* (0.32, 0.675)
* (0.40, 0.65)
* (0.48, 0.65)
* **Teal Line (g=7.5e-01):** This line shows a relatively flat trend with some fluctuations. It starts around an accuracy of 0.62 at a Deep-Thinking Ratio of 0.20 and remains around 0.65-0.67 until 0.48. Data points (approximate):
* (0.20, 0.62)
* (0.24, 0.64)
* (0.32, 0.65)
* (0.40, 0.65)
* (0.48, 0.65)
The shaded regions around each line indicate variability, but the exact nature of this variability (e.g., standard deviation, confidence interval) is not specified.
### Key Observations
* The gray line (g=5.0e-01) demonstrates the highest accuracy at a Deep-Thinking Ratio of approximately 0.32.
* The blue line (g=2.5e-01) shows the most stable accuracy after a Deep-Thinking Ratio of 0.24.
* The teal line (g=7.5e-01) exhibits the least change in accuracy across the range of Deep-Thinking Ratios.
* The annotation "r = 0.012" suggests a correlation coefficient, likely between the Deep-Thinking Ratio and Accuracy for the teal line.
### Interpretation
The chart suggests that there is an optimal "Deep-Thinking Ratio" for maximizing accuracy, and this optimal ratio is dependent on the "threshold" value (g). The threshold value likely represents a parameter controlling the depth or complexity of the "thinking" process. A Deep-Thinking Ratio of around 0.32 with a threshold of 5.0e-01 appears to yield the highest accuracy. The correlation coefficient of 0.012 for the teal line indicates a very weak positive correlation between Deep-Thinking Ratio and Accuracy when g=7.5e-01. The shaded areas around the lines suggest that the relationship between Deep-Thinking Ratio and Accuracy is not deterministic and is subject to some degree of variability. The annotation values (0.820 and 0.962) are likely related to some metric or calculation performed on the data, but their exact meaning is unclear without further context. The chart is likely presenting results from an experiment or simulation investigating the impact of a "Deep-Thinking Ratio" on the performance of a model or system.